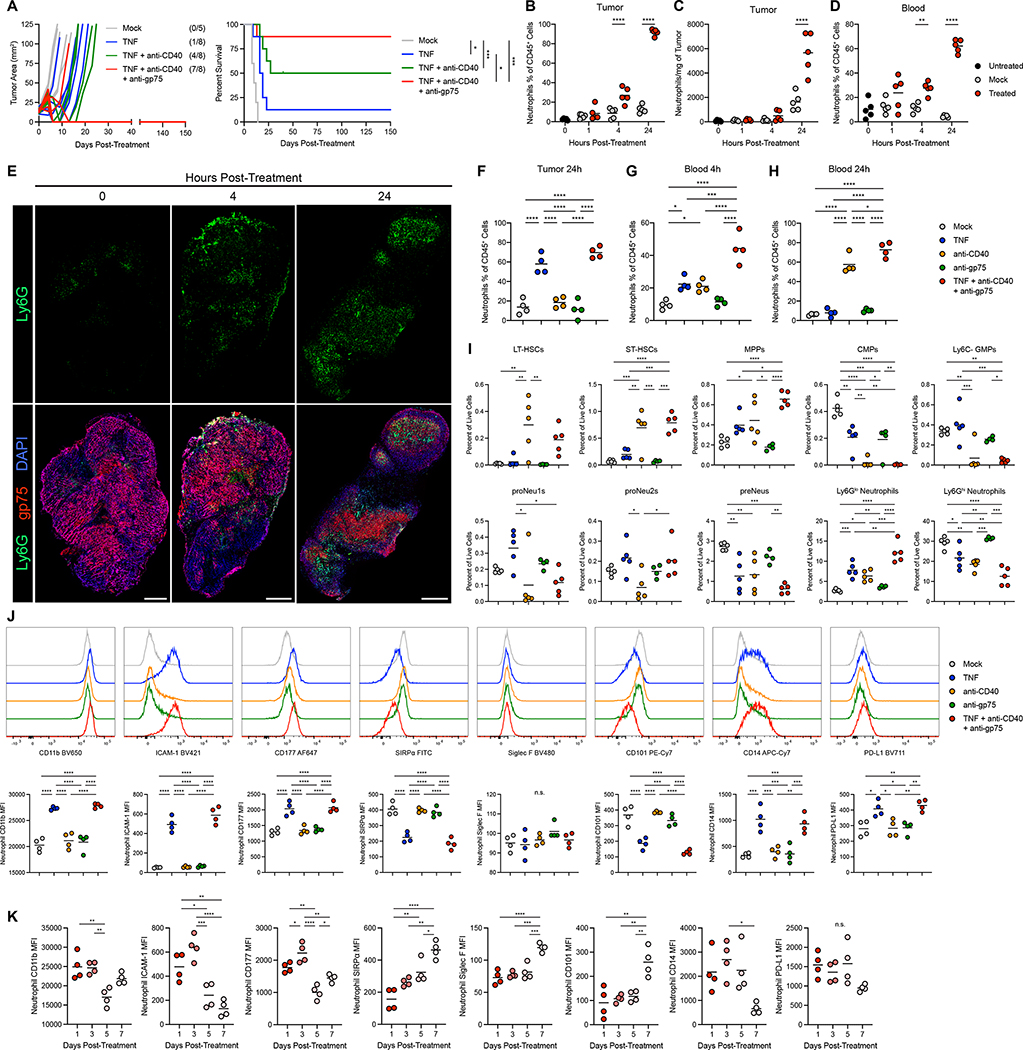
Figure 1: Neutrophil-activating therapy recruits activated neutrophils to the tumor.
(A) (Left) Tumor growth in B16-bearing mice following treatment with the indicated components, indicating mice with undetectable tumors at the conclusion of the study in parentheses. (Right) Survival of the mice shown in the left panel. Mice were euthanized when tumors exceeded 100mm2. (B-C) Neutrophil frequency (B) and numbers (C) in B16 tumors following treatment with TNF + anti-CD40 + anti-gp75. (n=5) (D) Neutrophil frequency in peripheral blood following treatment with this neutrophil-activating therapy. (n=5) (E) Immunofluorescence of neutrophil infiltration in B16 tumors following treatment with neutrophil-activating therapy. Scale bars = 500 μm. (F-H) Neutrophil frequency in the tumor (F) and blood (G-H) 4 hours (G) or 24 hours (F, H) after treatment with the indicated components. (n=4) (I) Frequencies of HSCs and progenitors in the bone marrow 24 hours after treatment with neutrophil-activating therapy. (anti-gp75 n=4, other groups n=5) (J) Representative histograms (top) and median fluorescent intensity (MFI) (bottom) of surface markers on neutrophils infiltrating B16 tumors 4 hours after treatment with the indicated components. (n=4) (K) Surface marker expression on B16 tumor-infiltrating neutrophils following treatment with the full neutrophil-activating therapy. (n=4). Statistics: Log-rank test with Bonferroni correction (A), One-way ANOVA with Tukey’s multiple comparisons test (B-D, F-K). For all dot plots, the line indicates the mean. Data are representative of 2 (B-E) or 3 (F-H) independent experiments or pooled from 2 experiments (A). See also Figures S1, S2.

