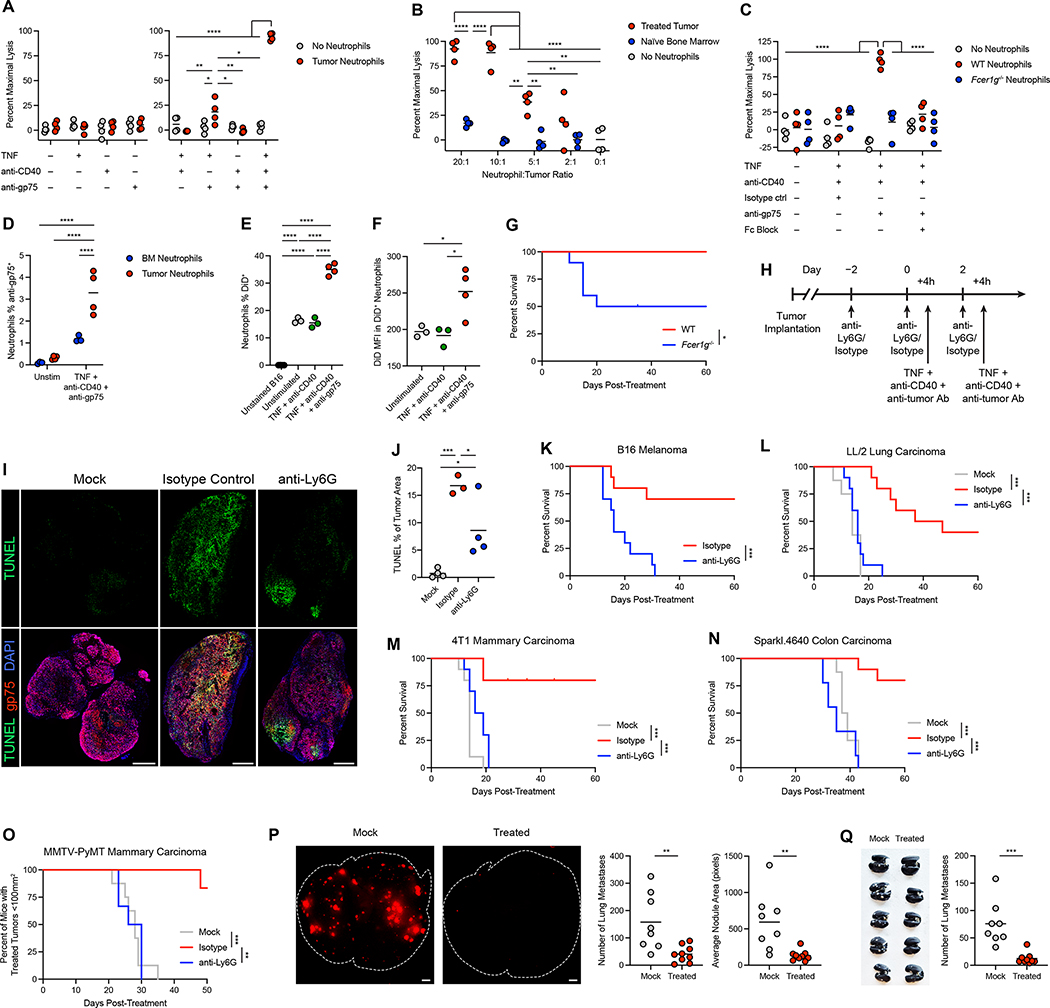
Figure 2: Therapeutically activated neutrophils eradicate multiple tumor types and reduce metastatic seeding.
(A) Lysis of B16 cells co-cultured with neutrophils isolated from treated tumors and stimulated in vitro with the indicated components. (n=4) (B) Lysis of B16 cells co-cultured with neutrophils isolated from treated tumors or tumor-naïve bone marrow, stimulated in vitro with TNF + anti-CD40 + anti-gp75. (n=4) (C) Lysis of B16 cells co-cultured with neutrophils isolated from treated tumors in WT or Fcer1g−/− mice, stimulated in vitro with TNF + anti-CD40 + anti-gp75 or isotype control, with or without anti-CD16/CD32 to block FcγRs. (n=4) (D) Signal from anti-gp75-AlexaFluor 647 in neutrophils isolated from treated tumors or naïve bone marrow and cultured in vitro with B16 cells together with TNF + anti-CD40 + anti-gp75-AlexaFluor 647 or no stimulation. (BM n=3, Tumor n=4) (E-F) Percent DiD+ neutrophils (E) and DiD MFI in DiD+ neutrophils (F) following co-culture of treated tumor neutrophils with DiD-labeled B16 and stimulation in vitro with the indicated components. (Unstained/triple n=4, Unstimulated/double n=3) (G) Survival of B16-bearing WT or Fcer1g−/− mice following treatment with neutrophil-activating therapy. (n=10) (H) Regimen for neutrophil depletion and therapy. Treatment was performed 4 hours after administration of anti-Ly6G or isotype control on days 0 and 2. (I-J) Representative TUNEL immunofluorescence (I) and quantification (J) in B16 tumors 24 hours after treatment with neutrophil-activating therapy, following neutrophil depletion with anti-Ly6G or isotype control. Scale bars = 500 μm. (Isotype n=3, others n=4) (K) Survival of B16-bearing mice administered anti-Ly6G or isotype control prior to neutrophil-activating therapy. (n=10) (L-N) Survival of mice bearing LL/2 (L) (mock n=8, others n=10), 4T1 (M) (n=10), and Sparkl.4640 (N) (mock n=8, isotype n=10, anti-Ly6G n=9) tumors administered anti-Ly6G or isotype control prior to neutrophil-activating therapy. (O) Percent of MMTV-PyMT mice with treated tumors below the threshold of 100 mm2 following treatment of one tumor per mouse in the context of anti-Ly6G or isotype control (mock n=8, others n=6). (P) Representative images of B16-tdTomato fluorescence in the lung (left) and quantification of the number and average area of tdTomato+ lung metastases (right) in mice bearing s.c. B16 tumors that were injected intravenously through the tail vein with B16-tdTomato one week after tumor implantation. Ten hours after tail vein injection, s.c. tumors were treated with mock or neutrophil-activating therapy, and the lungs were harvested and imaged 9 days after the tail vein injection. Lung borders are outlined in white. Scale bars = 1 mm. (mock n=8, treated n=9) (Q) Representative image of India ink-stained lungs (left) and number of lung metastases (right) 30 days after orthotopic implantation of 4T1, in mice receiving neutrophil-activating therapy or mock treatment (mock n=8, treated n=9). Statistics: Two-way ANOVA with Tukey’s multiple comparisons test (A-D), One-way ANOVA with Tukey’s multiple comparisons test (E-F, J), Log-rank test (F, K), Log-rank test with Bonferroni correction (L-O), unpaired two-tailed t test (P-Q). For all dot plots, the line indicates the mean. Data are representative of 2 (A-J, P) or 3 (K) independent experiments or pooled from 2 (Q), 3 (L-N), or 6 (O) experiments. See also Figure S3.

