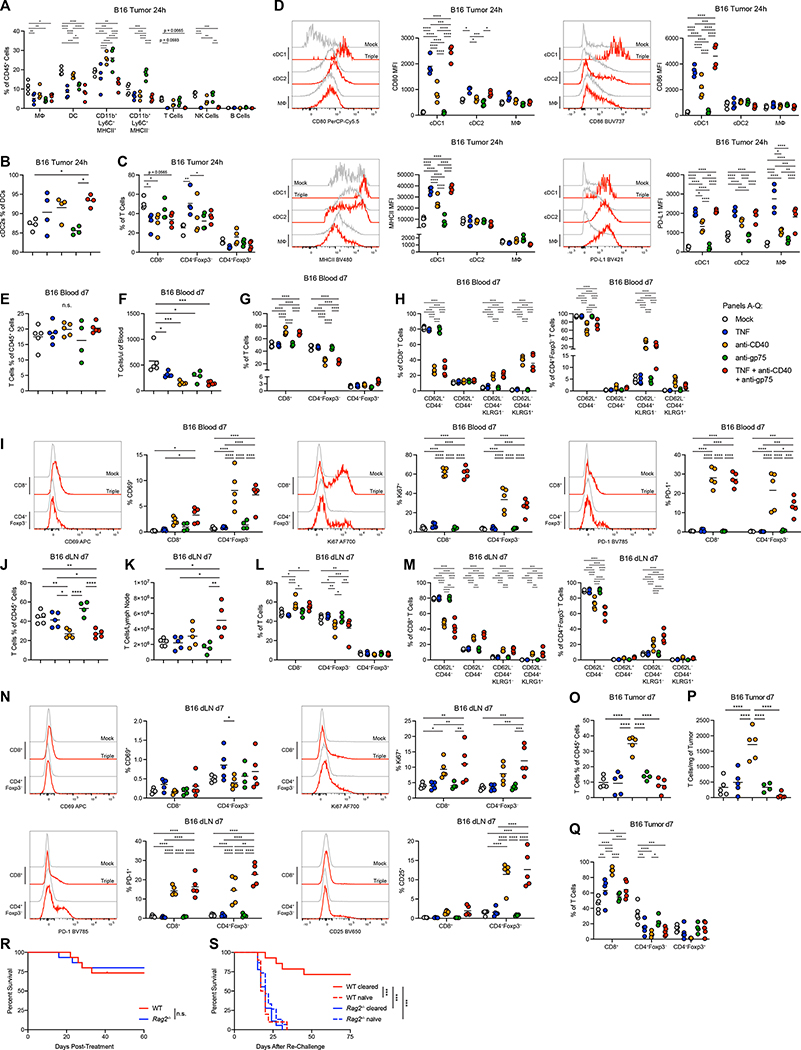
Figure 3: Therapy activates antigen-presenting cells and primes T cell memory.
(A) Frequency of immune cell subsets in B16 tumors 24 hours after treatment (n=4). (B) Percent of cDC2s out of total DCs in B16 tumors 24 hours after treatment (n=4). (C) Percent of T cell subsets out of total T cells in B16 tumors 24 hours after treatment (n=4). (D) Representative histograms and MFIs for markers expressed on APC populations in B16 tumors 24 hours after treatment (n=4). (E-F) Frequencies (E) and numbers (F) of T cells in the blood 7 days after treatment of B16 (anti-gp75 n=4, others n=5). (G) Percent of T cell subsets out of total T cells in the blood 7 days after treatment of B16 (anti-gp75 n=4, others n=5). (H) Memory and effector phenotypes of T cell subsets in the blood 7 days after treatment of B16 (anti-gp75 n=4, others n=5). (I) Representative histograms and MFIs for markers expressed on T cell subsets in the blood 7 days after treatment (anti-gp75 n=4, others n=5). (J-K) Frequencies (J) and numbers (K) of T cells in the dLN 7 days after treatment of B16 (anti-gp75 n=4, others n=5). (L) Percent of T cell subsets out of total T cells in the dLN 7 days after treatment of B16 (anti-gp75 n=4, others n=5). (M) Memory and effector phenotypes of T cell subsets in the dLN 7 days after treatment of B16 (anti-gp75 n=4, others n=5). (N) Representative histograms and MFIs for markers expressed on T cell subsets in the dLN 7 days after treatment (anti-gp75 n=4, others n=5). (O-P) Frequencies (O) and numbers (P) of T cells in the tumor 7 days after treatment of B16 (anti-gp75 n=4, others n=5). (Q) Percent of T cell subsets out of total T cells in the tumor 7 days after treatment of B16 (anti-gp75 n=4, others n=5). (R) Survival of B16-bearing WT or Rag2−/− mice treated with neutrophil-activating therapy (n=15). (S) Survival of WT or Rag2−/− mice following implantation of B16 in tumor-naïve or B16-cleared mice 50 days after initial treatment with neutrophil-activating therapy (WT cleared n=14, Rag2−/− cleared n=18, WT naïve n=10, Rag2−/− naïve n=15). Statistics: Two-way ANOVA with Tukey’s multiple comparisons test (A, E-I, L-N, Q), One-way ANOVA with Tukey’s multiple comparisons test (B-D, J-K, O-P), Log-rank test (R), Log-rank test with Bonferroni correction (S). For all dot plots, the line indicates the mean. Data are representative of 2 (A-Q, S) or 3 (R) independent experiments. See also Figures S4, S5.

