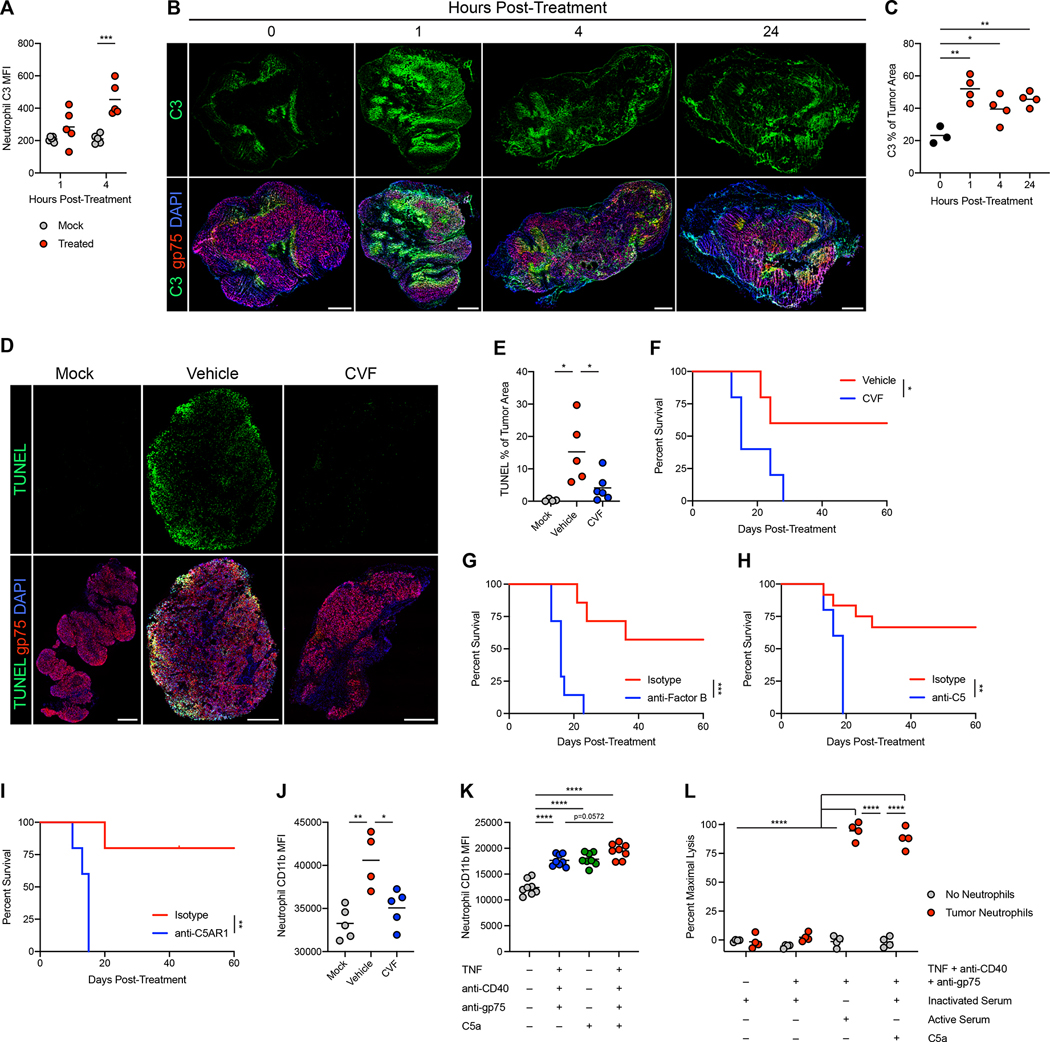
Figure 4: Complement activates tumor-infiltrating neutrophils through C5AR1.
(A) Deposition of C3 on B16 tumor-infiltrating neutrophils following treatment with neutrophil-activating therapy (n=5). (B-C) Representative immunofluorescence (B) and quantification (C) of C3 staining in B16 tumors after treatment. Scale bars = 500 μm. (0h n=3, others n=4) (D-E) Representative immunofluorescence (D) and quantification (E) of TUNEL staining in B16 tumors 24 hours after treatment of mice that had received CVF or vehicle prior to treatment. Scale bars = 500 μm. (mock n=4, vehicle n=5, CVF n=6) (F) Survival of B16-bearing mice administered CVF prior to treatment with neutrophil-activating therapy. (n=5) (G-I) Survival of B16-bearing mice administered anti-Factor B (G) (n=7), anti-C5 (H) (isotype n=12, anti-C5 n=5), and anti-C5AR1 (I) (n=5) blocking antibodies prior to treatment. (J) Expression of CD11b on B16 tumor-infiltrating neutrophils 4 hours after treatment following CVF or vehicle administration (vehicle n=4, others n=5). (K) Expression of CD11b on naïve neutrophils following stimulation in vitro with the indicated factors (n=8). (L) Lysis of B16 cells co-cultured with neutrophils isolated from treated tumors and stimulated in vitro with the indicated factors (n=4). Statistics: Two-way ANOVA with Tukey’s multiple comparisons test (A, L), One-way ANOVA with Tukey’s multiple comparisons test (C, E, J-K), Log-rank test (F-I). For all dot plots, the line indicates the mean. Data are representative of 2 (A-C, F-G, I-L) or 3 (D-E) independent experiments or pooled from 2 experiments (H). See also Figures S6, S7.

