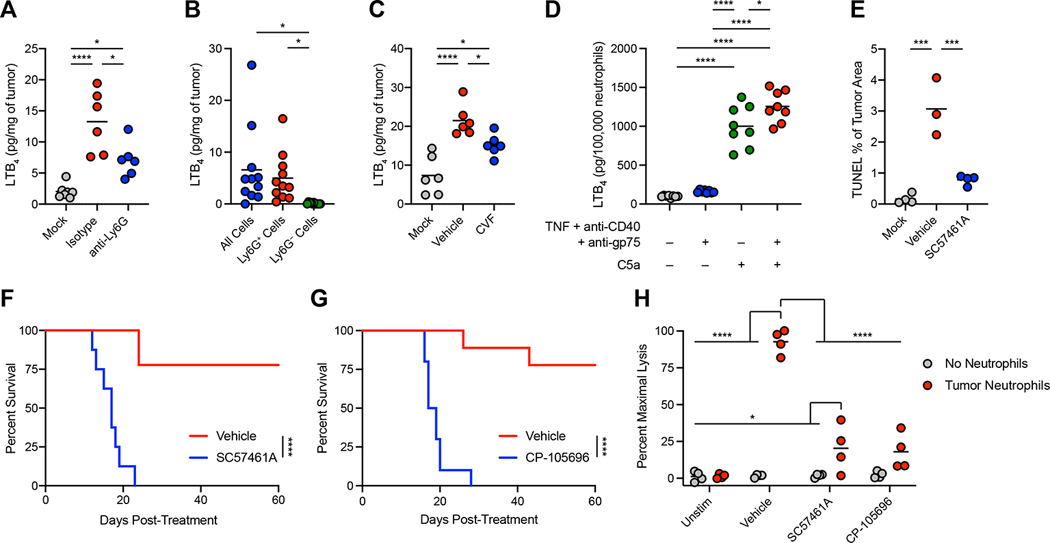
Figure 5: Secretion of leukotriene B4 by C5a-activated neutrophils drives tumor clearance.
(A) LTB4 levels in B16 tumors 24 hours after treatment with neutrophil-activating therapy following neutrophil depletion by anti-Ly6G (mock n=7, others n=6). (B) LTB4 produced ex vivo by cells harvested from B16 tumors 12 hours after treatment (n=11). (C) LTB4 levels in B16 tumors 24 hours after treatment following administration of CVF (n=6). (D) LTB4 production by naïve neutrophils following stimulation in vitro with the indicated factors (n=8). (E) Quantification of TUNEL staining in B16 tumors 24 hours after treatment with neutrophil-activating therapy following administration of SC57461A (vehicle n=3, others n=4). (F-G) Survival of B16-bearing mice after treatment following administration of SC57461A (F) (vehicle n=9, SC57461A n=8) or CP-105696 (G) (vehicle=9, CP-105696 n=10). (H) Lysis of B16 cells co-cultured with neutrophils isolated from treated tumors and stimulated in vitro with neutrophil-activating therapy together with the indicated inhibitors (n=4). Statistics: One-way ANOVA with Tukey’s multiple comparisons test (A, C-E), Repeated measures one-way ANOVA with Tukey’s multiple comparisons test (B), Log-rank test (F-G), Two-way ANOVA with Tukey’s multiple comparisons test (H). For all dot plots, the line indicates the mean. Data are representative of 2 (A, C-D, H) or 1 (E) independent experiments or pooled from 2 experiments (B, F-G). See also Figure S8.

