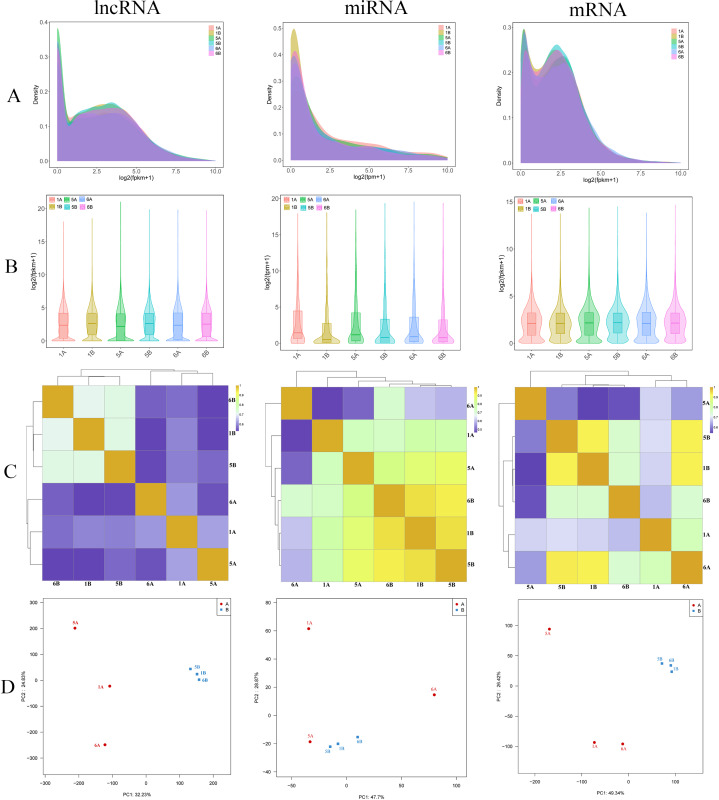
Figure 1. Sequencing data analysis.
(A and B) The lncRNA, miRNA and mRNA expression density distribution graphs and violin graphs of the sequenced samples. (C) Sample correlation heatmap based on lncRNA, miRNA and mRNA expression of the sequenced samples. (D) PCA of lncRNAs, miRNAs and mRNAs of the sequenced samples. Group A (1A, 5A and 6A) represents the tumor group, and Group B (1B, 5B and 6B) represents the normal group.

