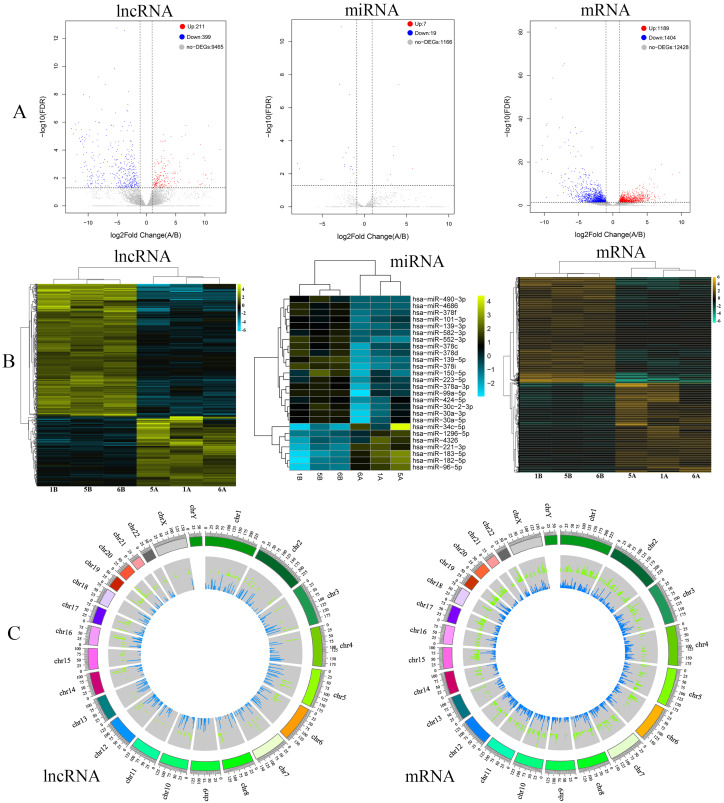
Figure 2. Analysis of differentially expressed RNAs.
(A) Volcano plots of differentially expressed lncRNAs, miRNAs and mRNAs in sequencing data of hepatocellular carcinoma. The red dots represent upregulated RNAs, and the blue dots represent downregulated RNAs. The gray dots represent genes with no significant difference. (B) Heatmap of differentially expressed lncRNAs, miRNAs and mRNAs in the sequencing data of hepatocellular carcinoma. (C) Circos plots of lncRNAs and mRNAs of sequencing data in the human genome (hg19). The outer tracks represent the chromosome. For the two tracks, the outer one (red) represents the levels of upregulated lncRNAs and mRNAs between hepatocellular carcinoma and precancer tissues, and the inner one (green) represents the levels of downregulated lncRNAs and mRNAs between hepatocellular carcinoma and precancer tissues.

