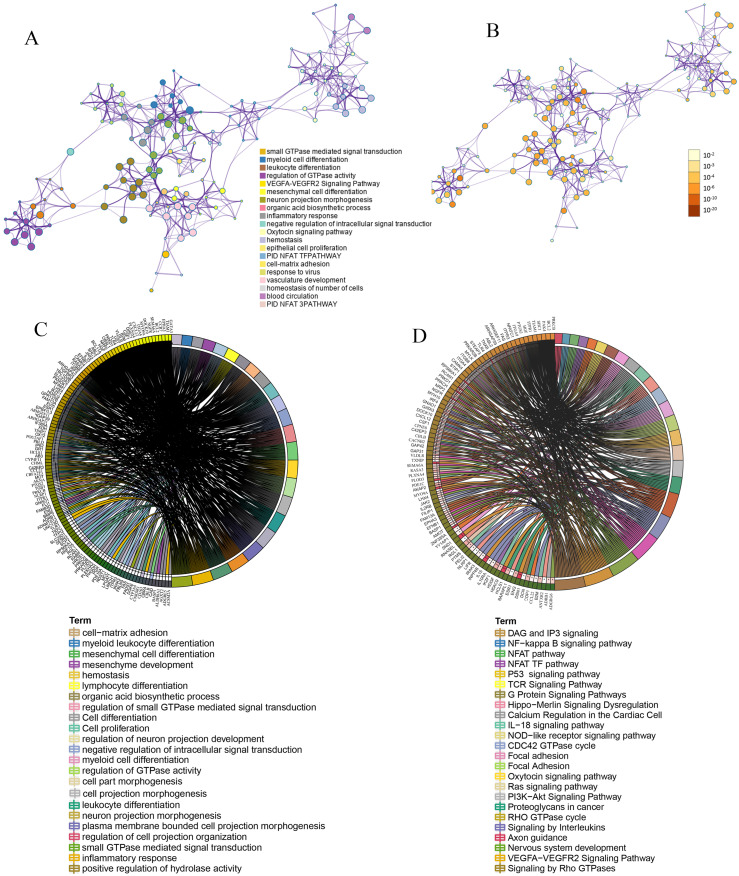
Figure 5. Function enrichment.
Functional and KEGG enrichment analysis of mRNAs in ceRNA. (A) Network of GO and KEGG enriched terms of mRNAs in ceRNA. A subset of enriched terms was selected and rendered as a network plot, where terms with a similarity >0.3 were connected by edges. a: colored by cluster ID, where nodes that share the same cluster ID are typically close to each other. b: colored by p value, where terms containing more genes tend to have a more significant p value. (B) Chord diagram showing enriched GO clusters for mRNAs in ceRNA. a: GO enrichment. b: KEGG enrichment. In the chord diagram, mRNAs are shown on the left, and enriched GO clusters are shown on the right.

