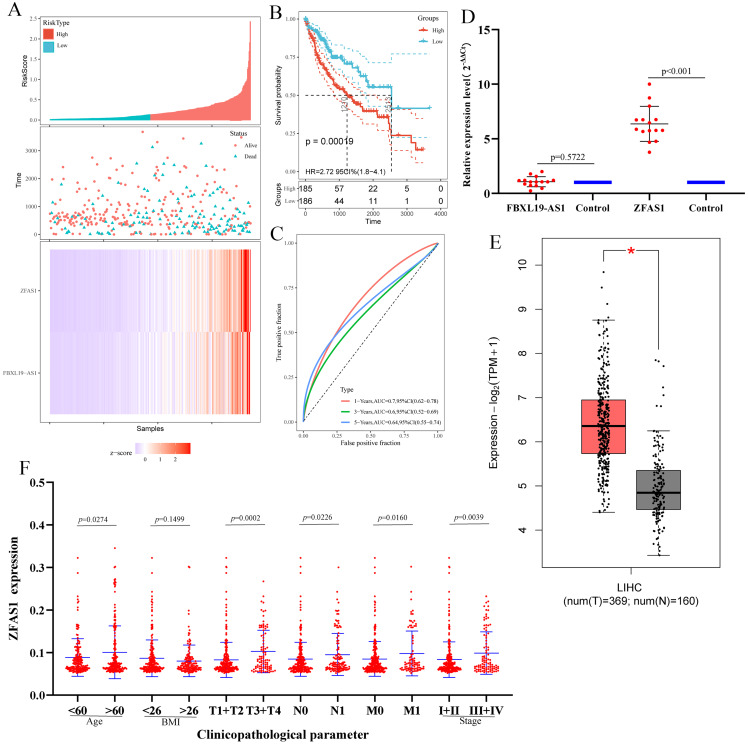
Figure 7. Risk model construction.
(A) The risk score, scatter plot distribution and heatmap on the basis of ZFAS1 and FBXL19-AS1 at low‐ and high‐risk levels. (B) Kaplan-Meier survival curves of ZFAS1 and FBXL19-AS1 expression at low‐ and high‐risk levels. (C) The ROC curves for predicting survival in hepatocellular carcinoma patients by the risk score. (D) Expression of ZFAS1 and FBXL19-AS1 in hepatocellular carcinoma tissues assessed by qPCR. The expression level of actin was used as an internal reference, and the data are shown as the mean ± standard deviation. (E) Expression of ZFAS1 in hepatocellular carcinoma from TCGA by GEPIA. *p < 0.05. “T” represents the tumor, which is represented by the red bar graph; “N” represents the non-tumor, and the blue bar chart indicates. (F) The expression of ZFAS1 correlated significantly with clinicopathological parameters.

