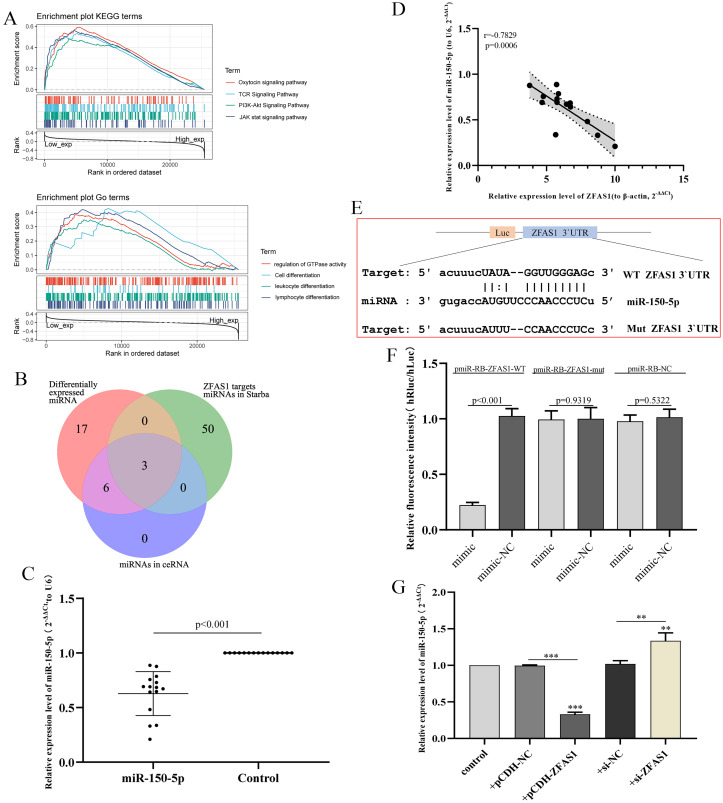
Figure 8. Correlation analysis of miR-150-5p and ZFAS1.
(A) Gene set enrichment analysis (GSEA) of ZFAS1. (B) The Venn diagram shows the common miRNAs in the three analysis results. (C) Expression of miR-150-5p in hepatocellular carcinoma tissues assessed by qPCR. The expression level of U6 was used as an internal reference, and the data are shown as the mean ± standard deviation. (D) Correlation analysis between ZFAS1 and miR-150-5p in hepatocellular carcinoma tissues. (E) Sequences of miR-150-5p and the ZFAS1 3′UTR binding sites. (F) Results of the dual-luciferase assay for miR-150-5p and ZFAS1. (G) Effect of interfering with ZFAS1 expression on miR-150-5p expression in HepG2 cells by qPCR. The expression level of U6 was used as an internal reference, and the data are shown as the mean ± standard deviation. The horizontal line indicates the comparison between groups at both ends, and the nonhorizontal line indicates the comparison with the control group. ***p < 0.001. **p < 0.01.

