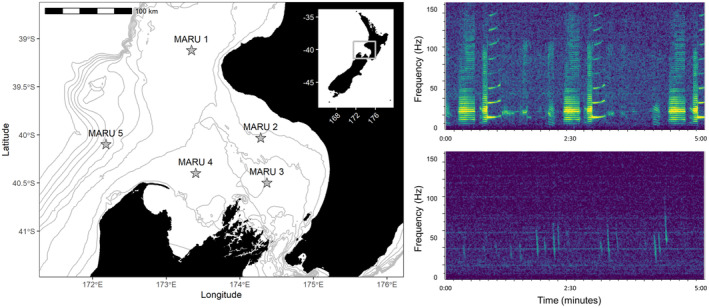
FIGURE 1.

Study area map and blue whale call spectrograms. Left panel: map of the study area in the South Taranaki Bight region, with hydrophone (marine autonomous recording unit; MARU) locations denoted by the stars. Gray lines show bathymetry contours at 50 m depth increments, from 0 to 500 m. Location of the study area within New Zealand is indicated by the inset map. Right panels: example spectrograms of the two blue whale call types examined: the New Zealand song recorded on 31 May 2016 (top) and D calls recorded 20 September 2016 (bottom). Spectrograms are configured with a 3072 point fast Fourier transform, Hann window, 50% overlap.
