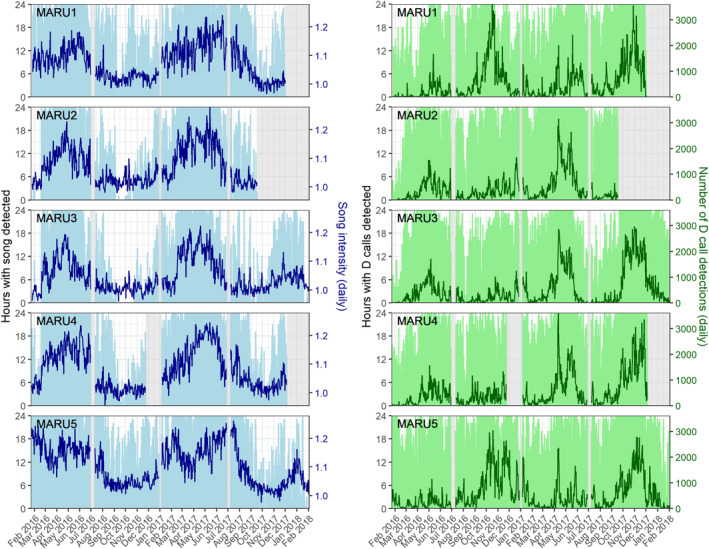
FIGURE 2.

Occurrence patterns of song and D calls. Left panels: number of hours per day with song detected (light blue bars) and daily song intensity index (dark blue lines) for each hydrophone (MARU 1–5) over the entire recording period. Right panels: number of hours per day with D calls detected (light green bars) and number of D call detections per day (dark green lines) for each hydrophone over the entire recording period. The hydrophone is listed at the top of each panel, corresponding to map locations in Figure 1. Periods with light gray shading indicate gaps in recording due to hydrophone refurbishment.
