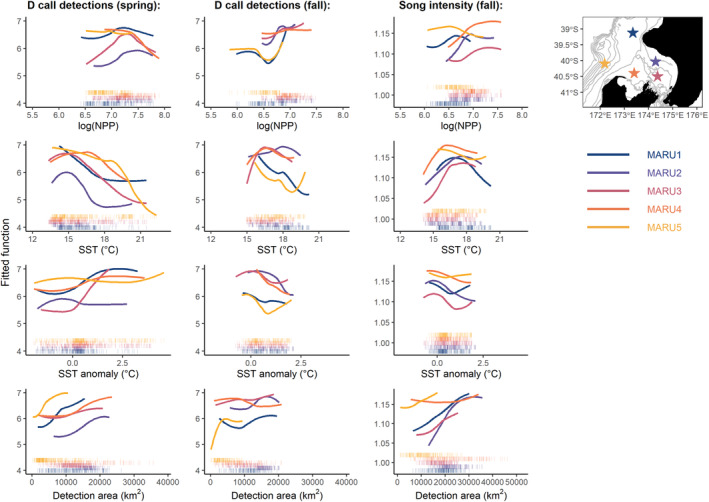
FIGURE 4.

Functional response curves for environmental correlates of calling activity. Partial dependence plots derived from the boosted regression tree fitted for each within‐season peak in calls, showing the smoothed functional relationships between calling (either song intensity index or D call detections) and each predictor variable while fixing all other variables at their mean value. Color is indicative of the hydrophone, with locations shown on the map in upper right panel. Rug plots show distribution of the values for each predictor.
