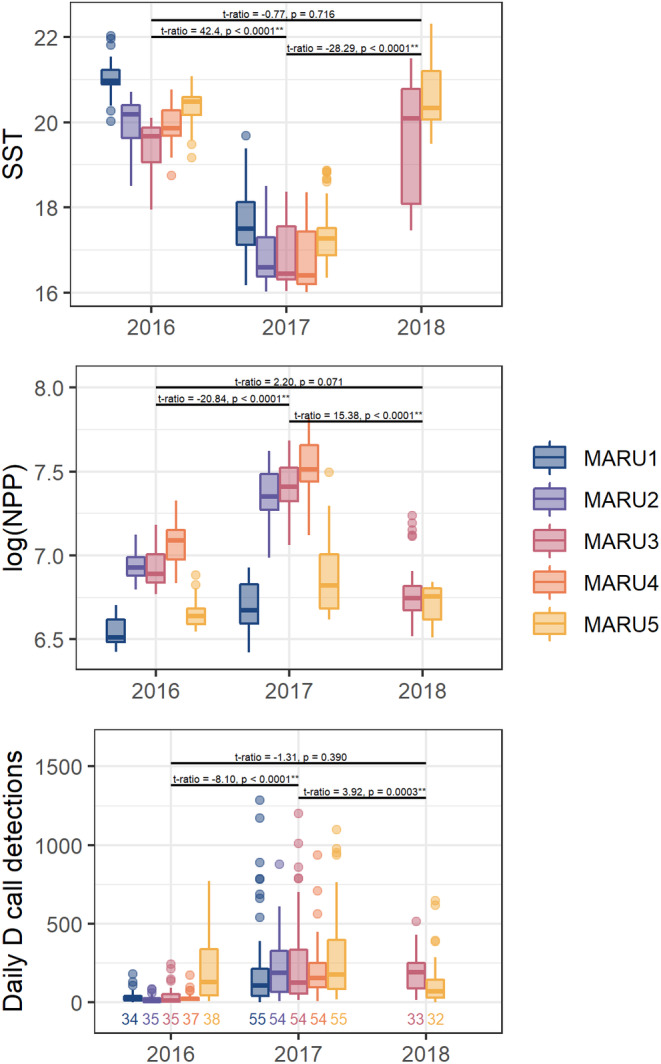
FIGURE 6.

Environmental conditions and D calls in summer months. Mean sea surface temperature (top), net primary productivity (middle), and daily D call detections (bottom) for the period of 1 January through 28 February in each of the three years with recording coverage, with each of the five hydrophone recording locations indicated by colors. The number of recording days for each hydrophone in each year are indicated in the bottom panel. January and February were characterized by regional marine heatwaves in 2016 and 2018, while 2017 exhibited more typical summer upwelling conditions. Pairwise comparisons resulting from a linear mixed model for each variable by year (accounting for differences among hydrophone locations) are indicated above each set of boxplots. In all cases, the linear mixed models were significant, with the two marine heatwave years characterized by comparable SST, log(NPP), and D call values that were significantly different from those measured in the more typical upwelling year.
