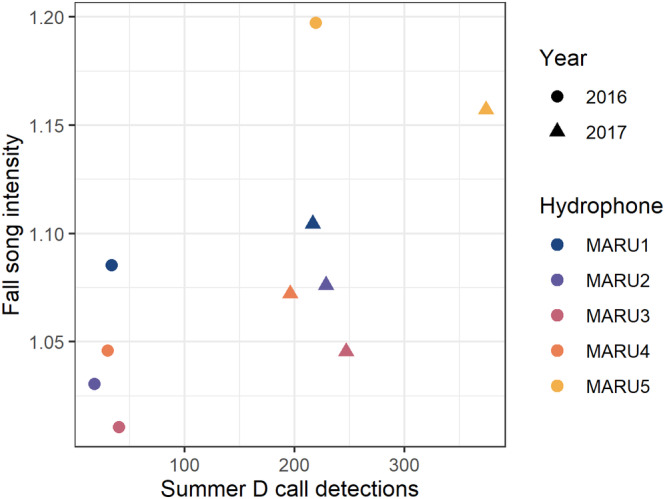
FIGURE 7.

Relationship between summer D call detections and fall song intensity. Relationship between the mean number of D call detections between 1 January through 28 February and the mean song intensity index in the subsequent fall peak between 1 April and 31 June. Points are symbolized by year and hydrophone recording location.
