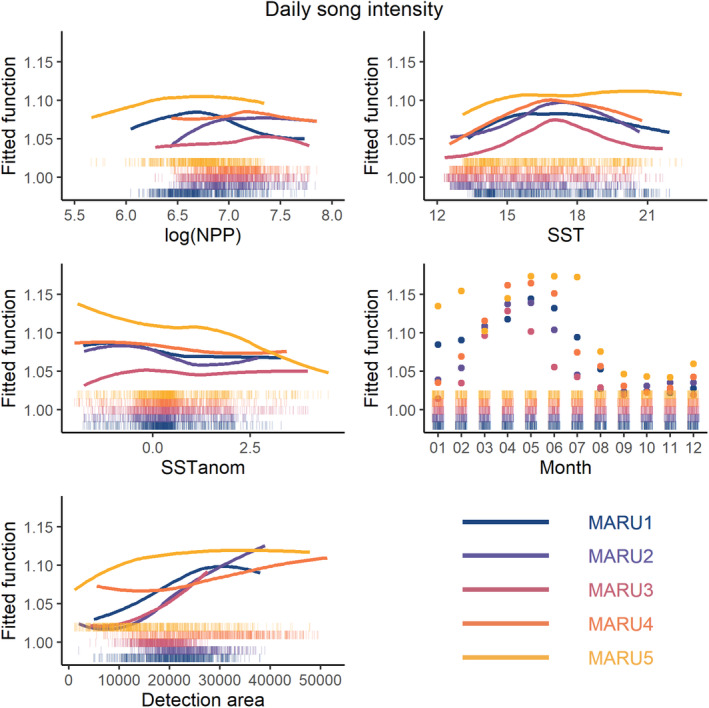
FIGURE A4.

Partial dependence plots derived from the boosted regression tree models for song, showing the smoothed functional relationships between song intensity and each predictor variable while fixing all other variables at their mean value. Color is indicative of the hydrophone. Rug plots show distribution of the values for each predictor, and color corresponds to the hydrophone.
