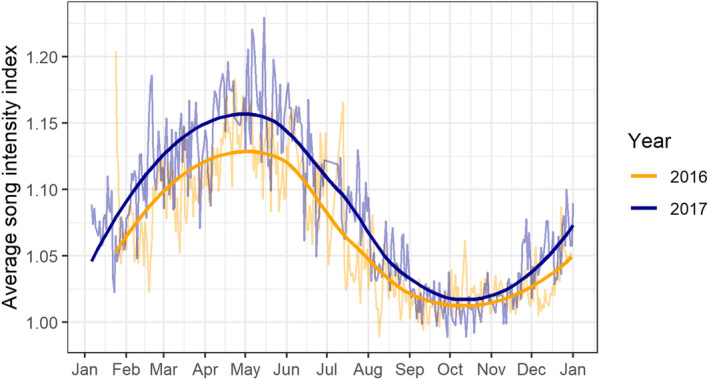
FIGURE A7.

Average annual cycle in song intensity index across all five hydrophone locations by year. Dark solid lines represent a loess smoothed fit. Note the alignment of the fall peak in song intensity in both years, but the lower average song intensity in 2016 than in 2017.
