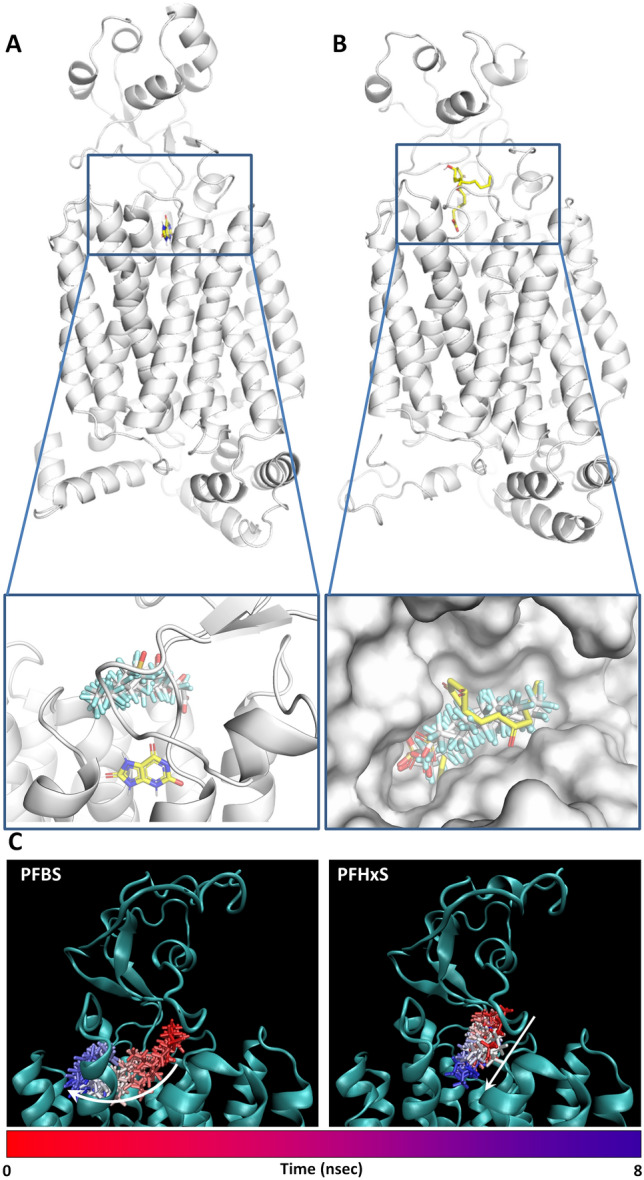
Fig. 5.

Computational results. A Binding architecture of PFASs and uric acid within URAT1. The whole protein is represented in cartoon and uric acid in yellow sticks. In the close-up detailing the binding site, PFASs are represented in white sticks, and uric acid in yellow sticks. B Binding architecture of PFASs and prostaglandin E2 within OAT4. The whole protein is represented in cartoon, whilst prostaglandin E2 is represented in yellow sticks. In the close-up detailing the binding site, PFASs are represented in white sticks, prostaglandin E2 in yellow sticks and protein is represented in white surface for a better view of pocket occupancy. C Molecular dynamics results of PFBS and PFHxS for OAT4. The from-red-to-blue colour switch indicates the stepwise changes of ligands coordinates along the simulation. The white arrows indicate the trajectory of ligands
