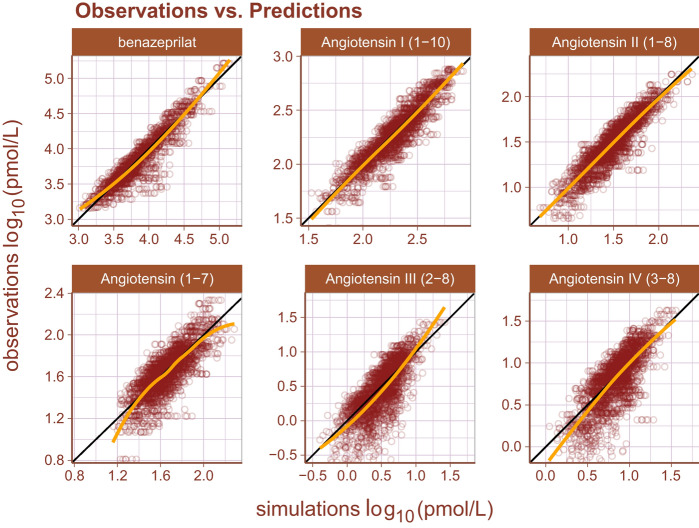
Figure 4.
Observations vs predictions. The observations plotted against the predictions for all metabolites and drug concentration data. This gives a complete picture of model performance. The golden line is the LOESS curve showing the correlation between observations and predictions. The black line plotted diagonally represents an ideal model performance with no misspecification. The general agreement between LOESS and idealized curve indicates that there is little misspecification in model structure.

