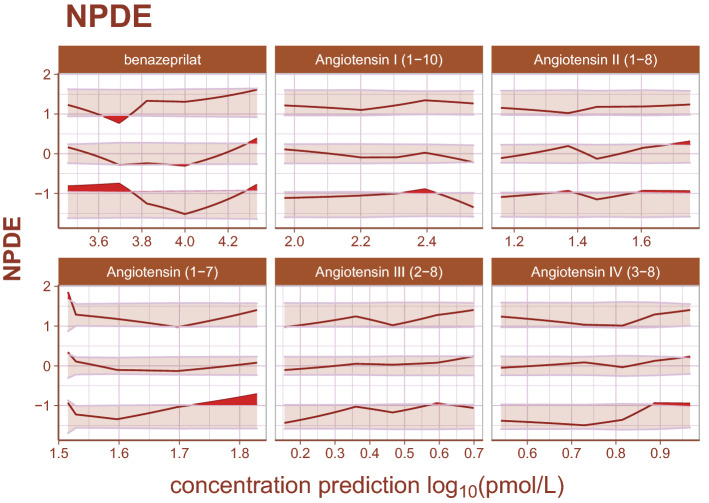
Figure 6.
Normalized prediction distribution errors. Normalized prediction distribution errors (NPDEs) are an analog to residuals used for diagnosing both model structural misspecifications as well as the performance of the residual error model. The distribution of a well-specified model is normal, ideally. Bands represent the 90% prediction band for the 95th, 50th, and 5th percentiles, respectively. Curves are the observed percentiles for the 95th, 50th, and 5th percentiles, respectively. Data are binned at regular intervals to derive these average trends. For each binning range, if the structural model fits the data well, observed percentiles will be symmetrically distributed across a 50th percentile curve which falls within the 50th percentile band. If the error model is well specified, observed percentiles will fall within prediction bands. Any misspecification is ideally random. The model appears to underpredict angiotensin (1–7) for small measured values slightly, but otherwise there is high agreement between model and data.

