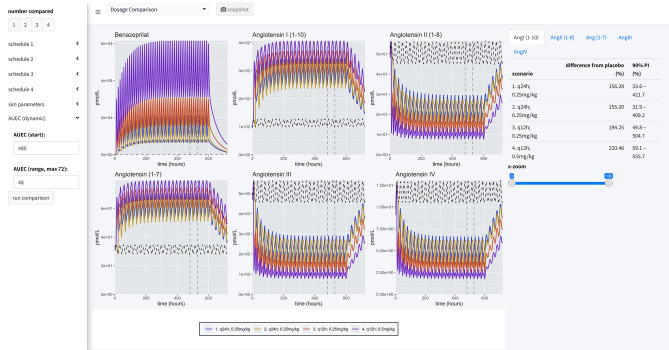
Figure 8.
Simulation summary. Four administration schedules are compared in this simulation scenario: (1) 0.25 mg/kg every 24 h at 8 a.m.; (2) 0.25 mg/kg every 24 h at 8 p.m.; (3) 0.25 mg/kg twice a day at 8 a.m. and 8 p.m.; (4) 0.5 mg/kg twice a day at 8 a.m. and 8 p.m. 500 individuals were simulated for each scenario (for a total of 2500 individuals, with placebo). Curves are the median time-course of the molecule from this simulated population. Comparisons between schedules are made by calculating the percent difference between the median AUC and placebo (of each schedule). Summary results are tabulated in Table 2.

