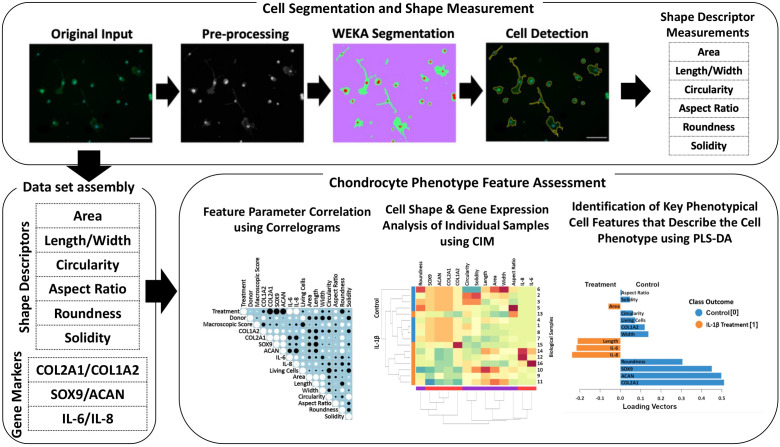
Figure 1.
Illustration of the workflow for high-throughput quantitative single cell morphometry in conjunction with multivariate data analysis that allows identification of cell morphological fingerprints. Single cells are first detected using trainable WEKA image segmentation, and then shape descriptors (e.g., area, length, width, circularity, aspect ratio, roundness, and solidity) on a large number of cells are measured. Together with other phenotypic data (e.g., gene expression profiles), the data set is assembled for multivariate cell feature analysis. The relationship between parameters is analyzed using correlograms, CIM, and PLS-DA. Correlograms demonstrate positive and negative relationships across the parameters. CIM can be used to illustrate the expression levels of the features on the biological sample level. Key morphological and other phenotypical cell features, which discriminate between (e.g., control vs. inflammatory) cell phenotypes are calculated using PLS-DA. This multivariate phenotyping approach is applicable to other conditions and cell types and identifies characteristic morphological fingerprints that describe a cell’s phenotype.

