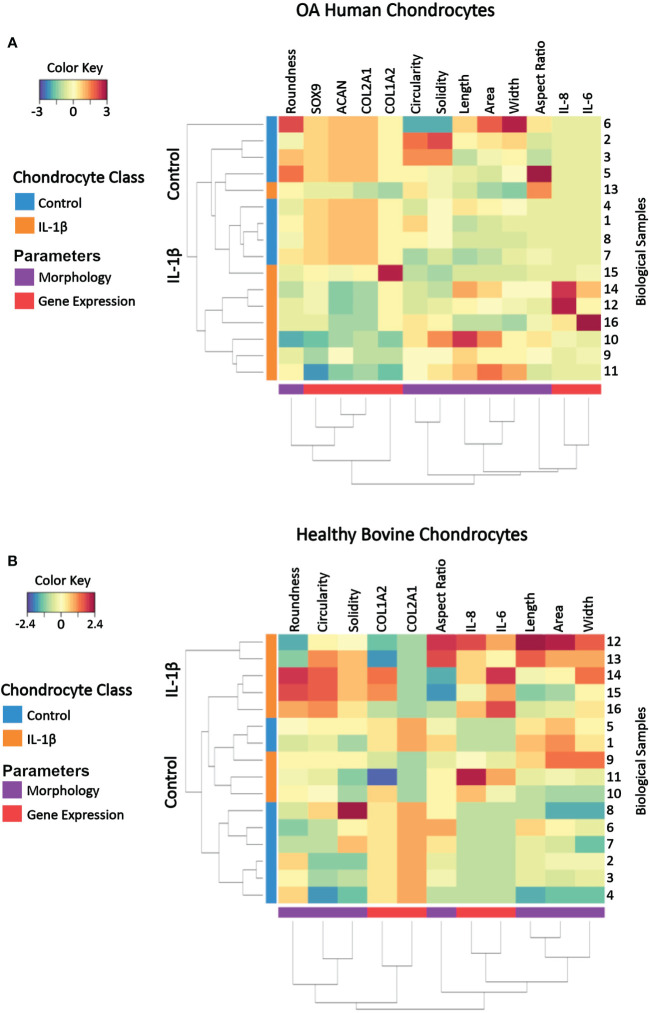
Figure 10.
Clustered image map of cell morphology and gene expression values from individual samples of (A) OA human and (B) healthy bovine chondrocytes that were untreated or treated with IL-1β. Each horizontal row represents 16 biological samples treated with or without IL-1β as indicated in the figure (n=8 per group isolated from n = 8 different OA donors and n = 3 healthy bovine cows with samples treated in duplicate or triplicate). Rows are clustered using cell morphology and gene expression and color-coded according to experimental conditions: control cells vs. IL-1β incubation. A CIM visualizes scaled and centered data, with a color code that indicates the standard deviations away from the mean of each feature, whereas the dendrograms indicate clustering. The level of the parameters of a given category and their intensity of the red color denotes the number of standard deviations above the overall mean across all samples and intensity of the blue color denotes the number of standard deviations below the overall mean representing increases and decreases in the markers from the overall mean category. Based on the multi-feature signatures, the CIM revealed a discrimination of the control vs. IL-1β and revealed signature patterns.

