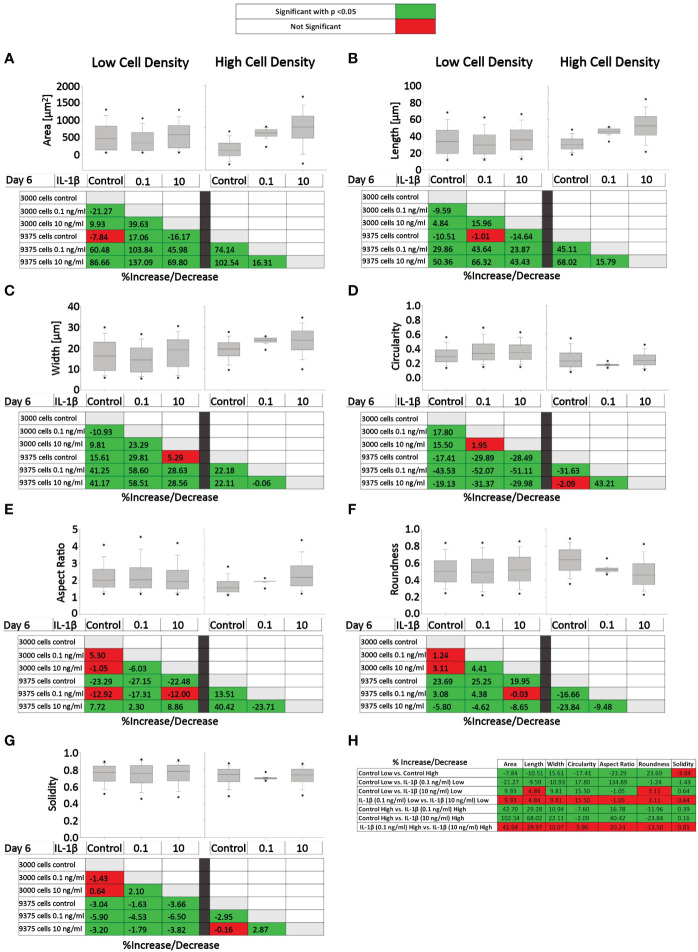
Figure 7.
Comparison of healthy bovine single cell morphology under persistent IL-1β conditions in low- and high-density cell cultures. Healthy bovine chondrocytes in high or low density cell cultures were treated with 0 (control), 0.1 ng/ml, or 10 ng/ml of IL-1β for 6 days. Data is representative of (A) area, (B) length, (C) width, (D) circularity, (E) aspect ratio, (F) roundness, and (G) solidity with 1181, 2024, and 2917 cells analyzed in the control, 1 ng/ml IL-1β, 10 ng/ml IL-1β-treated cells under low cell density culture conditions and 3604, 2583, and 1923 cells analyzed in the control, 0.1 ng/ml IL-1β, 10 ng/ml IL-1β-treated cells under high cell density culture conditions from n = 8 per group isolated from 3 different cows wit samples treated in duplicate or triplicate. Box plots: the boxes define the 25th and 75th percentiles, with a central line at the median; error bars define the 10th and 90th percentiles; and dots define the 5th and 95th percentiles. In the tables below each of the box plots, the percent changes (increase/decrease) between the specified conditions are provided, with the green color code indicating a significant difference (p<0.05) and the red color code indicating a non-significant difference the two conditions. (H) Percent increase/decrease values for each of the shape descriptors comparing the various conditions, with the green color code indicating a significant difference (p<0.05) and a red color code indicating a non-significant difference.

