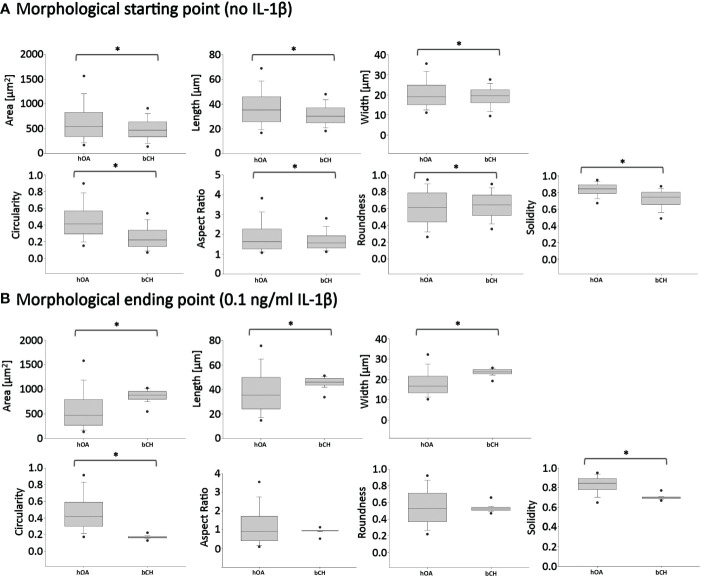
Figure 8.
Pairwise comparisons of shape descriptors between human OA vs. healthy bovine chondrocytes under similar high density culture conditions. To allow this side-by-side comparison, data reported in Figure 2 was used as input human OA (hOA) chondrocyte data and data reported in Figure 6 was used as input bovine chondrocyte (bCH) data. Day 6 after treatment. (A): hOA chondrocytes were compared to bCHs under control conditions (without IL-1β). (B): hOA chondrocytes were compared to bCHs under low dose IL-1β (0.1 ng/ml) conditions. The horizontal lines represent the median and the boxes show the 25th and 75th percentiles, while the vertical lines represent the 10th and 90th percentiles and the black points illustrate the 5th and 95th percentiles. *p<0.05.

