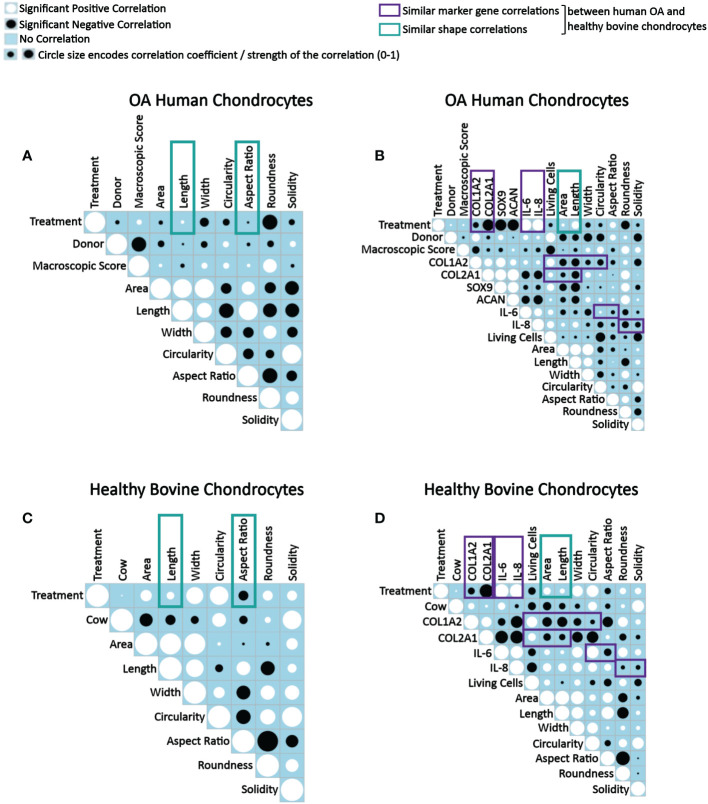
Figure 9.
Correlograms depicting correlations between parameters in OA human and healthy bovine chondrocytes across all conditions and highlighting similar correlations found in both cell types. Correlation matrix plots of (A, B) human OA chondrocytes treated with or without 0.1 ng/ml IL-1β (n = 8 per group from 8 different donors) and (C, D) healthy bovine chondrocytes treated with or without 10 ng/ml IL-1β (n = 8 per group from 3 different cows with samples treated in duplicate or triplicate). Significant positive correlations between the two specified conditions are represented as black circles, while significant negative correlations are represented as white circles (p<0.05). A blue box indicates a lack of correlation. The strength of the relationship is indicated by the size of the circle with a larger circle indicative of a stronger correlation (higher correlation coefficient). (A, C) Data is representative of values obtained from individually measured chondrocytes for each of the cell morphology descriptors (n = 20777 OA human chondrocytes from n = 16 control and IL-1β-treated samples; n = 2917 healthy bovine chondrocytes from n = 16 control and IL-1β-treated samples). (B, D) Data is representative of the average cell morphology and gene expression values of n= 16 individual experiments for OA human and healthy bovine chondrocytes. The control class was coded as 0 and the IL-1β treatment class was coded as 1. The purple and green boxes indicate similarities in data between OA human and healthy bovine chondrocytes.

