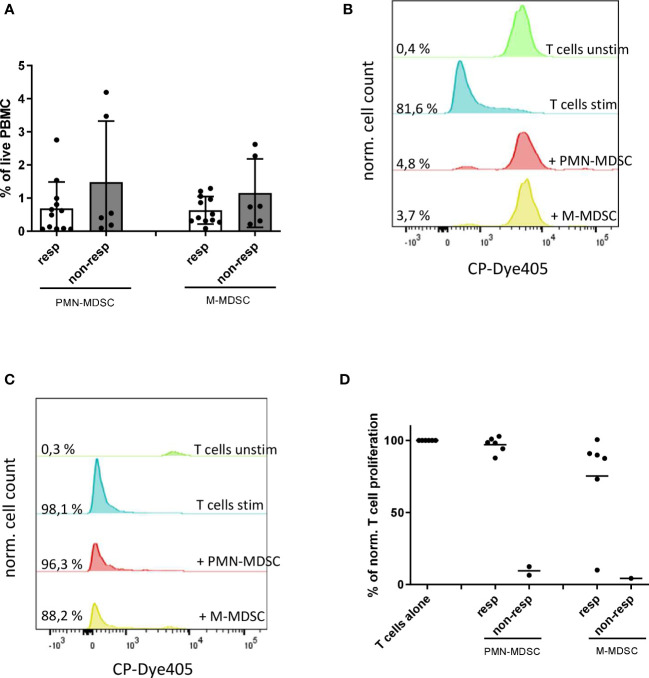
Figure 3.
Baseline characteristics of PMN- and M-MDSC from responders and non-responders. (A) Results are presented as the frequency of circulating PNM- and M-MDSC among live PBMC from responders (n=12) and non-responders (n=6). Representative histograms for the proliferation of unstimulated (unstim) and stimulated (stim) T cells incubated alone or in the presence of isolated PMN- or M-MDSC from a non-responding (B) and responding patient (C). (D) Immunosuppressive capacity of PMN- and M-MDSC was determined upon the co-culture with activated CD3 T cells labeled with CP-Dye405. Cumulative data for T cell proliferation are shown as the percentage of divided T cells normalized (norm.) to the respective control of stimulated T cells alone (n=2-8).

