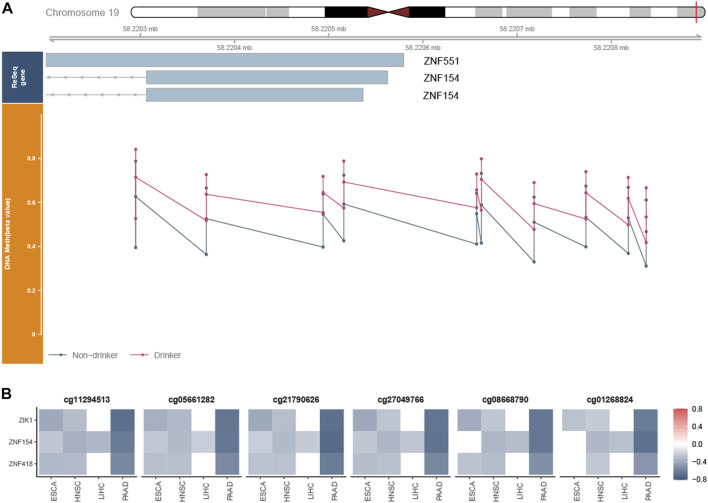
FIGURE 5.
Exploration of the CpG island chr19:58220189–58220517. (A) Whole view of CpG probes in the CpG island chr19:58220189–58220517 demonstrated its hypermethylation status. The bottom dot plots from left to right represent the beta values of cg1129451, cg0566128, cg21790626, cg27049766, cg03234186, cg08668790, cg12506930, cg26465391, cg01268824, and cg27324426, respectively. cg03142586 was excluded from further analysis since its beta value was NA in most samples. (B) Heatmap revealed the correlation between the beta value of six PDMPs and the expression of ZNF154, ZIK1, and ZNF418 in four cancer types.

