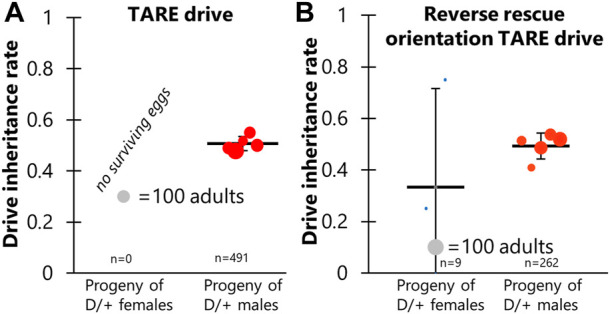
FIGURE 4.

TARE drive inheritance. Cross data are displayed for (A) TARE drive and (B) Reverse rescue orientation TARE drive. Drive inheritance was measured from crosses between drive individuals (heterozygous for the drive and for a Cas9 allele) and wild-type flies. Each dot represents offspring from one drive parent, and the size of dots is proportional to the number of total offspring. Rate and standard error of the mean are displayed for all flies pooled together. No instances of drive inheritance are significantly different from the Mendelian expectation (Binomial Exact Test).
