. 2022 Nov 8;306(3):e220522. doi: 10.1148/radiol.220522

Figure 4:

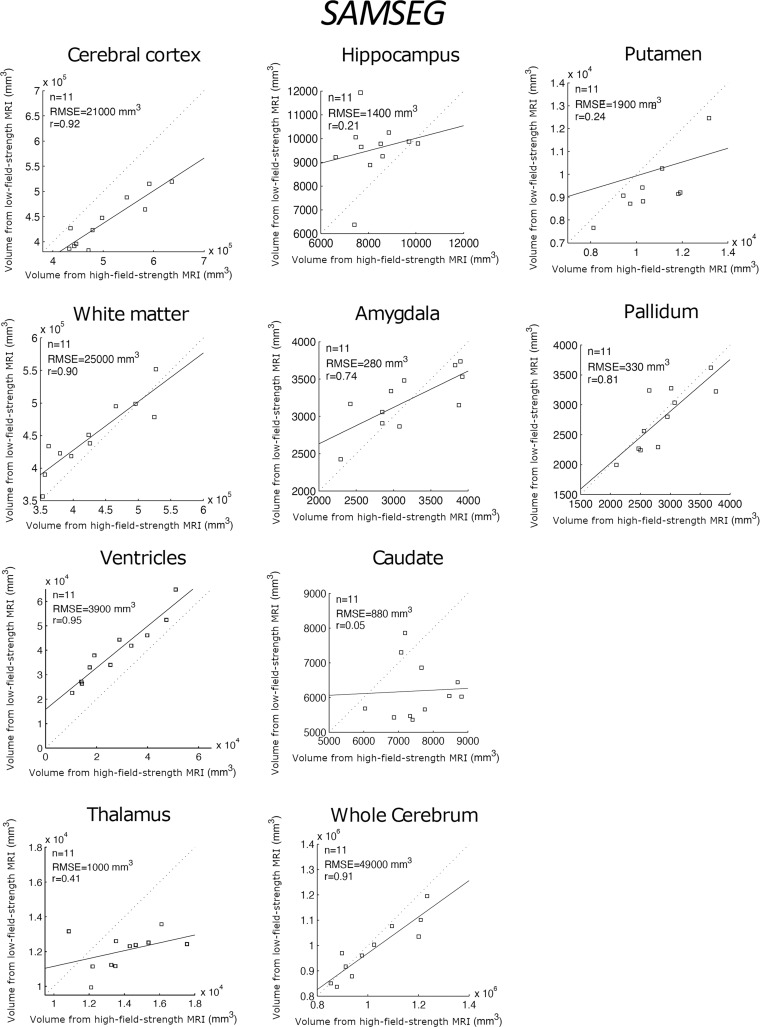
Scatterplots for SAMSEG, comparing the volumes of regions of interest derived from the high-field-strength MRI scans (ground truth) and from the low-field-strength MRI scans using the publicly available automated segmentation method SAMSEG (12). The root mean square error (RMSE) and correlation coefficient (r value) are shown.

Scatterplots for SAMSEG, comparing the volumes of regions of interest derived from the high-field-strength MRI scans (ground truth) and from the low-field-strength MRI scans using the publicly available automated segmentation method SAMSEG (12). The root mean square error (RMSE) and correlation coefficient (r value) are shown.