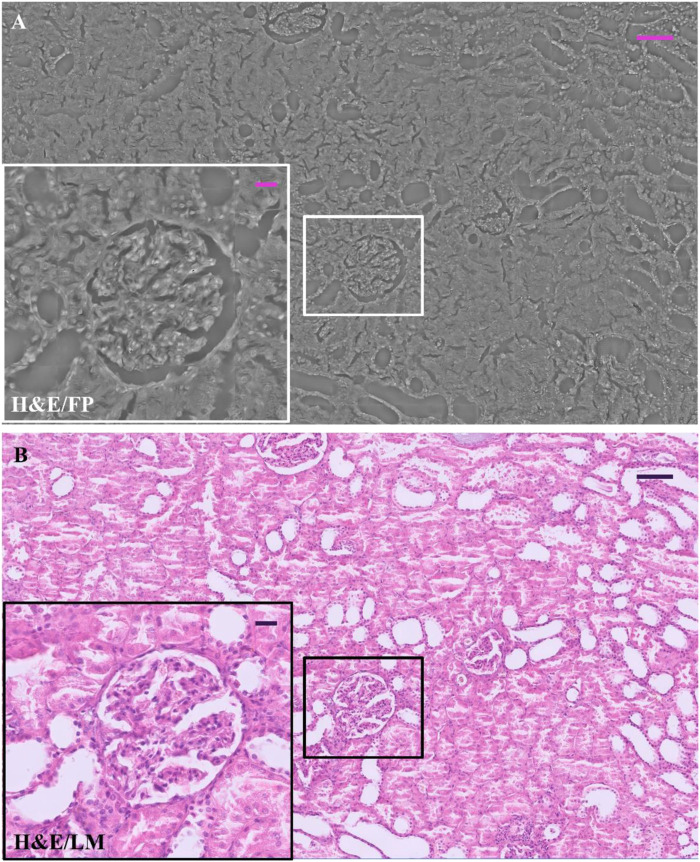
FIGURE 1.
H&E-stained renal tissue: (A) Whole renal tissue FP image; the inset (white box) zooms glomerulus captured by FP; (B) whole renal tissue LM image; the inset (black box) zooms glomerulus captured by LM. The scale bar in (A) and (B) is 105 μm, while the scale bar in the respective insets is 25 µm.

