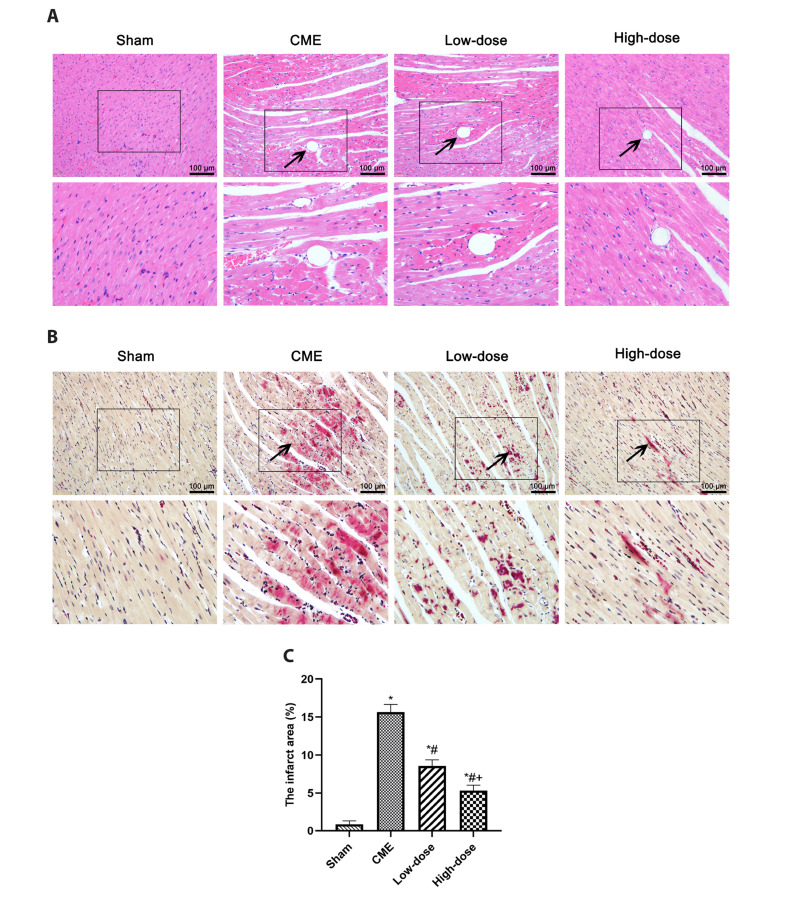
Fig. 3. Histopathological examination of myocardial tissues through H&E and HBFP staining.
(A) Representative H&E-stained myocardial sections from each group (×200 magnification; bar = 100 μm). The arrows indicate the microspheres. (B) Representative images of HBFP staining (×200 magnification; bar = 100 μm). The arrows indicate the microinfarct area. (C) The percentage of micro-infarct area in each group (n = 8 per group). Low-dose: CME + low-dose RES (25 mg/kg), High-dose: CME + high-dose RES (50 mg/kg). Data were presented as the mean ± SD. CME, coronary microembolization; RES, resveratrol. *p < 0.05, compared with Sham group; #p < 0.05, compared with CME group; +p < 0.05, compared with Low-dose group.

