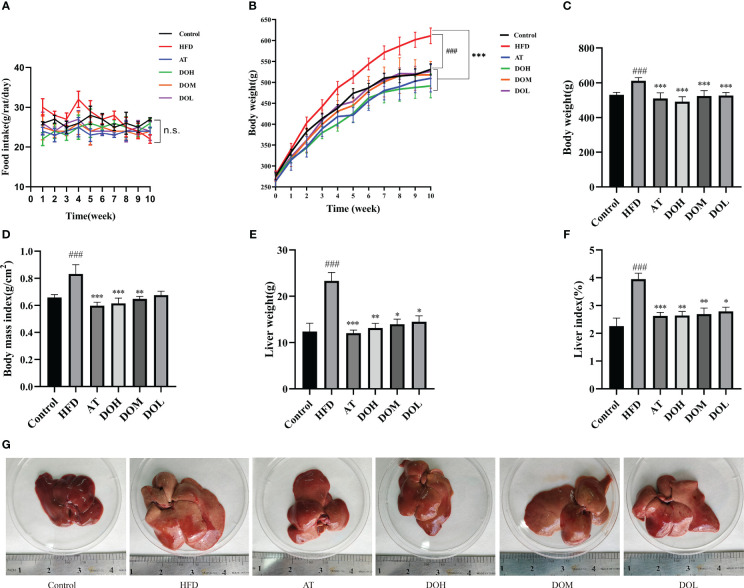
Figure 1.
(A) Temporal changes in food intake by group; (B) temporal changes in body weight by group; (C) final body weight by group; (D) body mass index by group; (E) liver weight by group; (F) liver index by group; (G) representative photo of a liver from each group. All data are shown as the mean ± SD (n=8). # p < 0.05, ### p < 0.001 vs. the Control group; *p < 0.05, **p < 0.01, ***p < 0.001 vs. the HFD group.

