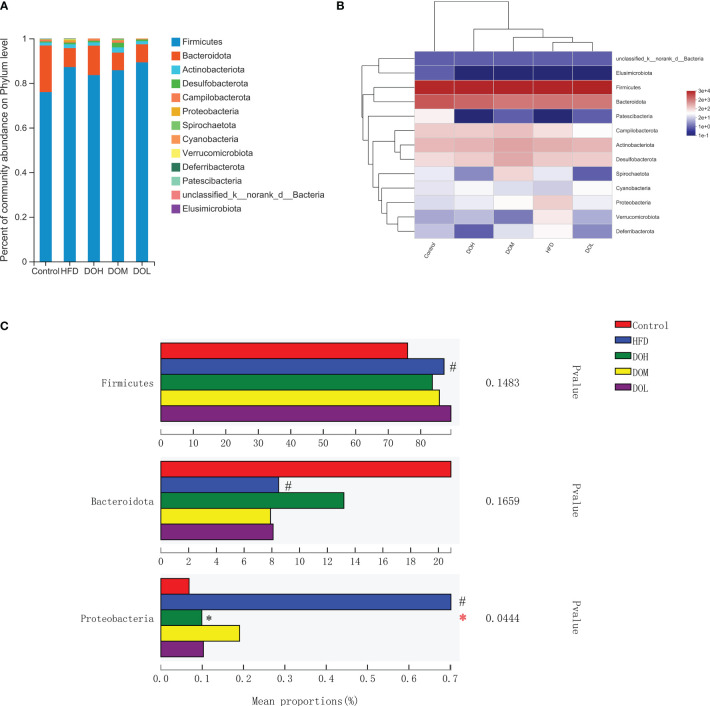
Figure 4.
DO treatment modulated the gut microbiota composition at the phylum level. (A) Community abundance at the phylum level (%); (B) heat map of cluster stacking at the phylum level; (C) the relative abundances of Firmicutes, Bacteroidetes, and Proteobacteria. Data are expressed as the mean ± SD (n=6). # p < 0.05 vs. the Control group; *p < 0.05 vs. the HFD group.

