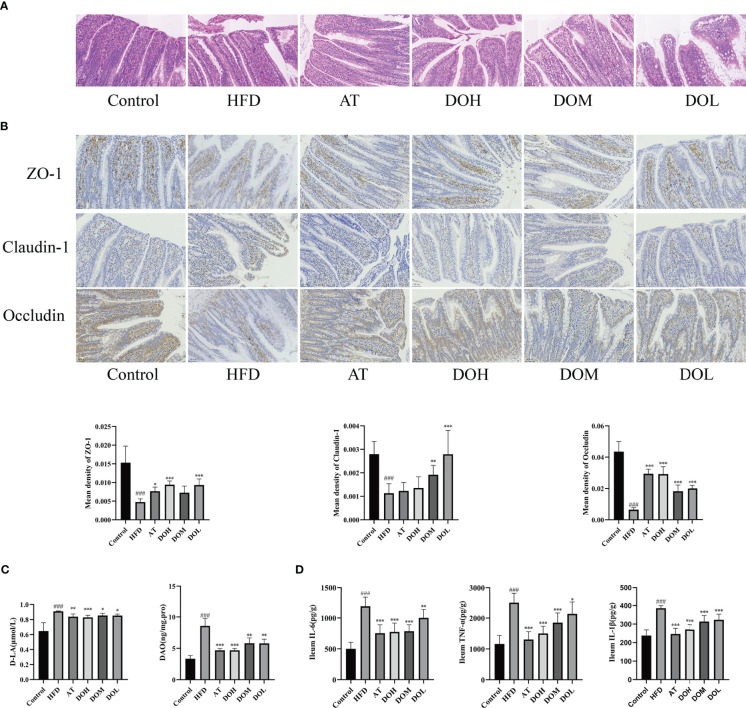
Figure 7.
Effect of DO on intestinal permeability. (A) Representative images of H&E staining of the ileum by group (400x magnification); (B) immunohistochemistry of the ileal tight junction protein by group (400x magnification); (C) ileum DAO and serum D-LA levels by group; (D) ileum IL-6, TNF-α, IL-1β levels by group. All data are shown as the mean ± SD (n=8). ### p < 0.001 vs. the Control group; * p < 0.05, ** p < 0.01, *** p < 0.001 vs. the HFD group.

