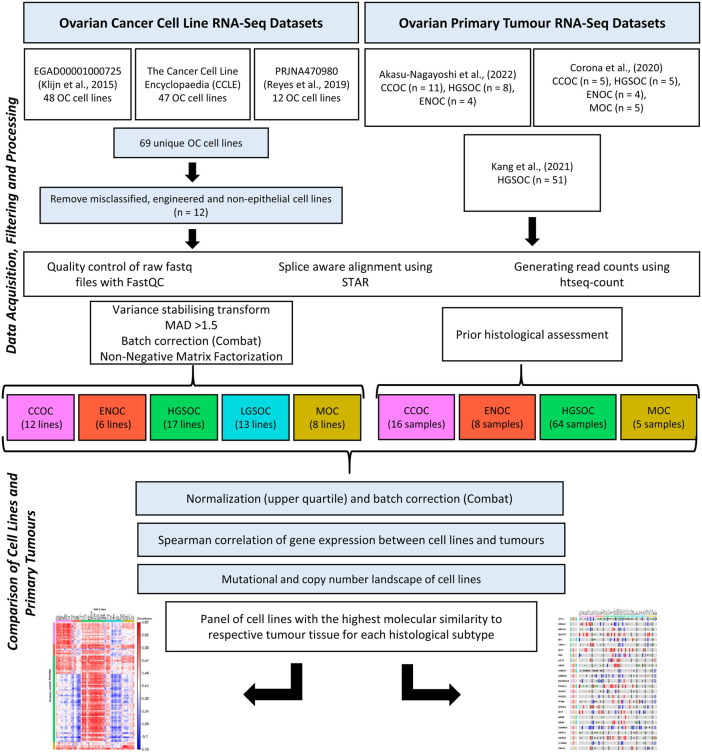
FIGURE 1.
Transcriptomic data for 56 EOC cell lines and 93 primary tumor samples were processed using the same bioinformatics pipeline. NMF was used to stratify the cell lines into putative histological subtypes while patient samples had undergone histological assessment. Mutations and copy number variations of cell lines were investigated to identify the lines most similar to EOC tumor subtypes, as delineated in the literature. Correlation analysis was also carried out on the cell line and tumor gene expression data to assess similarity between the two groups.

