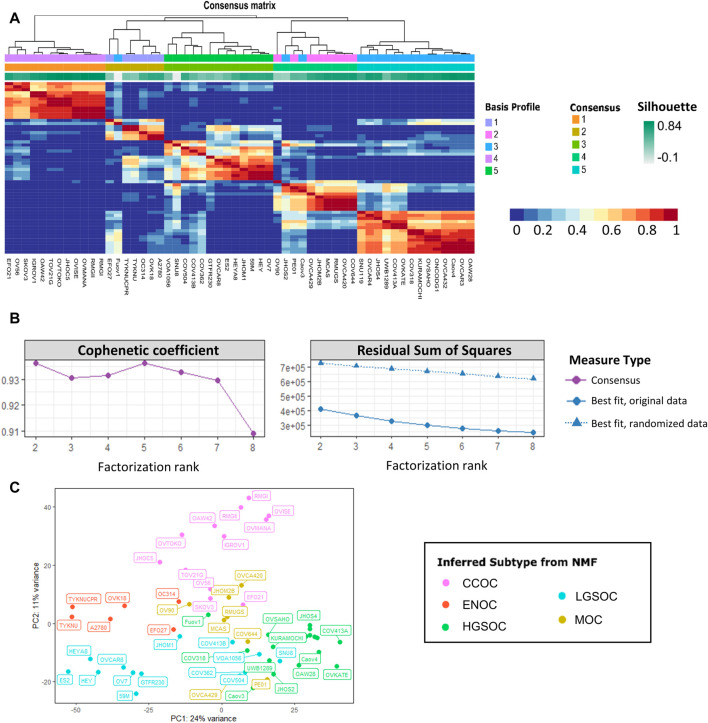
FIGURE 2.
Non-negative matrix factorization separates 56 EOC cell lines into five stable clusters. (A) Consensus map detailing cell line clustering for 200 NMF runs using a factorization rank of 5. The colors of each heatmap tile represent the likelihood of two cell lines clustering together. Rows and columns of the map are symmetrically ordered by hierarchical clustering using the consensus matrix as a similarity measure. Above the heatmap are the associated dendogram, basis profile, consensus and silhouette scores. (B) Factorization rank survey on both original and permuted data shows high quality metrics for a five-group split. Left displays cophenetic correlation coefficient and right details the residual sum of squares for both the original and randomized data. Color and shape of points represent the type of measure used. (C) PCA plot of the 56 EOC cell line samples, colored by inferred NMF subtype, shows clustering of putative subtypes.

