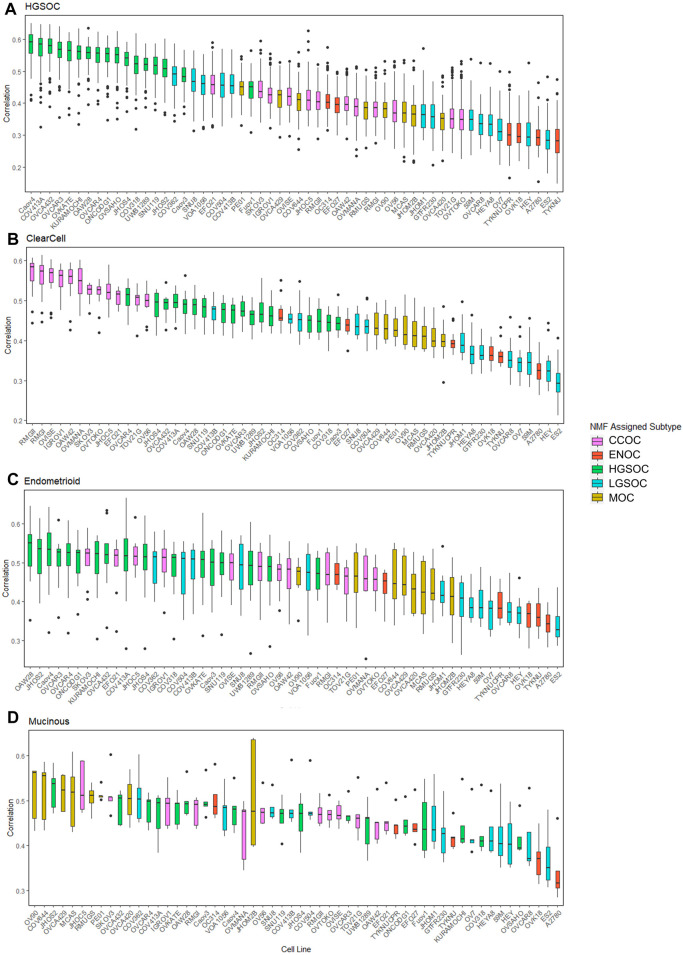
FIGURE 5.
Distribution of correlations between cell lines and primary tumors of varying subtypes. Each boxplot is ordered in decreasing rank of median correlation between a particular cell line and all tumors of each subtype, (A) HGSOC tumors, (B) CCOC tumors, (C) ENOC tumors and (D) MOC tumors. Each box is colored based on subtype assigned to each cell line by NMF.

