Figure 5.
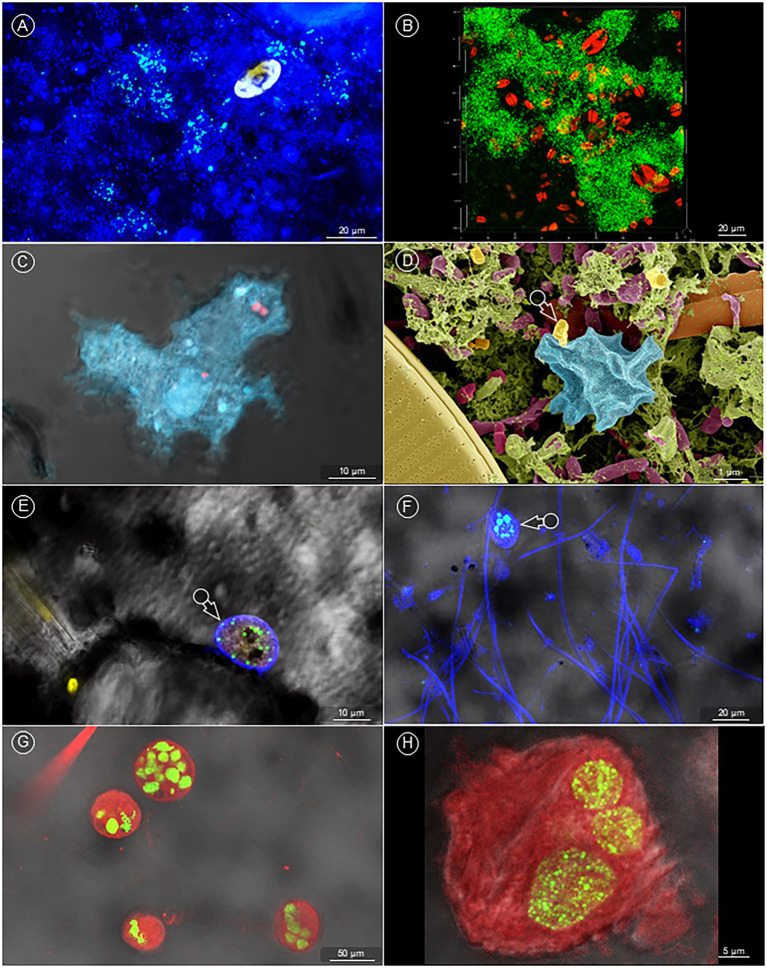
Visualization of Fth’ survival in natural ex vivo biofilm. (A) (CLSM image) GFP expressing Fth formed microcolonies (blue-greenish signal) within the natural biofilm (DAPI, dark blue) – diatom: yellowish autofluorescence). (B) (CLSM image) Fth formed a comprehensive, 3D biofilm (green) within the natural biofilm – diatoms: red autofluorescence. (C) (CLSM image) In the natural biofilm, Fth bacteria (red) were found ingested by amoebae (bright blue). (D) (SEM image) A bacterium, with the characteristic shape of Fth (arrow, compare with Figure 2B), is about to be ingested by an amoeba (bright blue). This scene enfolds between matrix (green) embedded bacteria (dark red) and various diatoms (ocker and orange). (E,F) (CLSM image) GFP expressing Fth bacteria within different types of ciliates (arrows). (G,H) Many Vorticella (red autofluorescence) in the natural biofilm showed accumulated Fth, which formed dense clusters (green).

