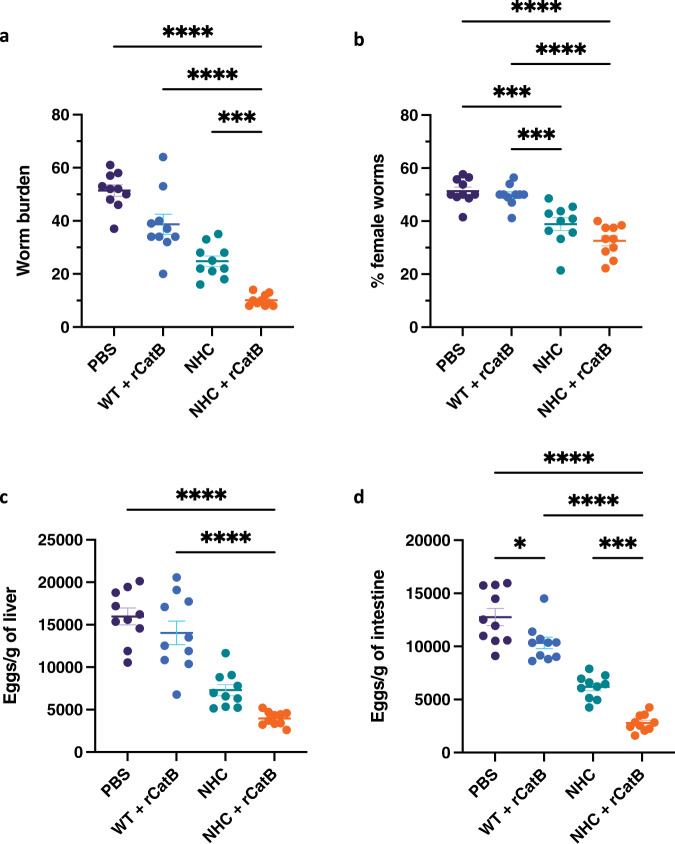
Fig. 4. Parasite burden.
The worm burden (a) and the percentage of female worms (b) were assessed 7 weeks post-challenge per individual mouse in each group. Egg loads were expressed per gram of liver (c) and intestine (d) for each group. Each independent experiment consisted of five animals per group. Each experiment was performed twice. Data were shown as mean ± SEM. Statistical significance was determined by one-way ANOVA with Tukey’s multiple comparisons (*P < 0.05, ***P < 0.001, and ****P < 0.0001).

