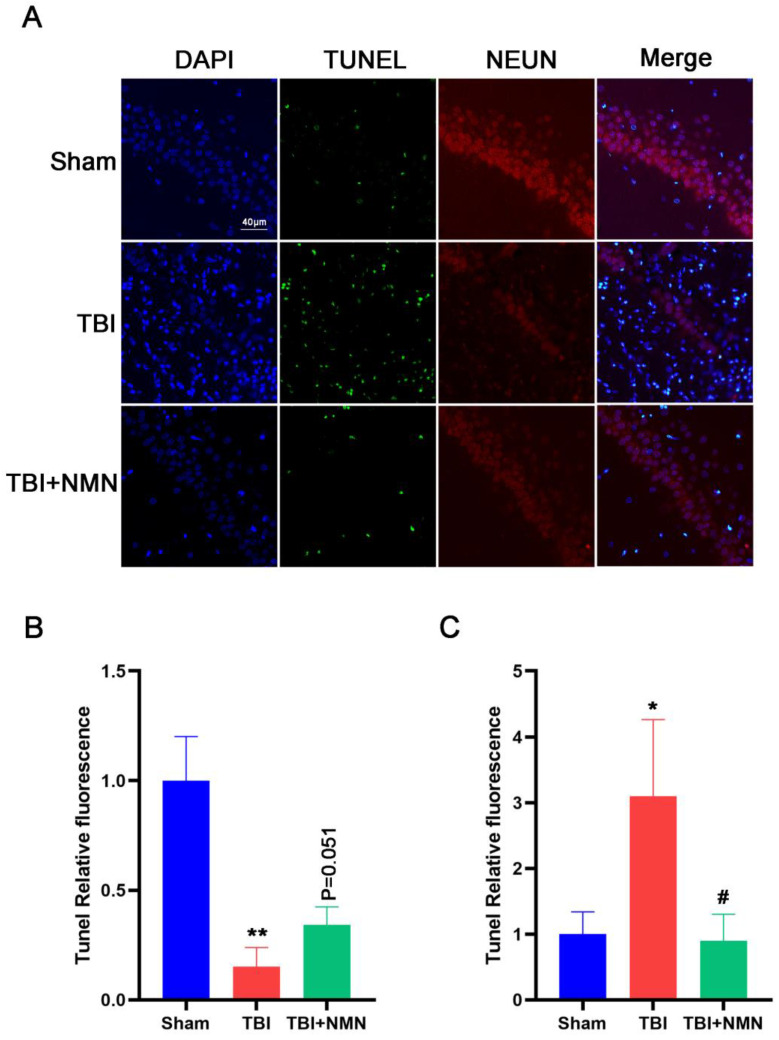
Figure 4.
NMN decreased neuronal apoptosis at 8 days after TBI. A) Representative images of NEUN, TUNEL, and DAPI costaining of brain sections. Scale bar: 40 nm (n =3 per group). B) Quantitative analysis of NEUN fluorescence intensity in CA1 region (n =3 per group). C) Quantitative analysis of TUNEL fluorescence intensity in CA1 region. (n =3 per group, *p < 0.05, **p < 0.01, and ***p < 0.001 TBI vs Sham group; #p < 0.05 and ##p < 0.01 TBI vs TBI +NMN group).

