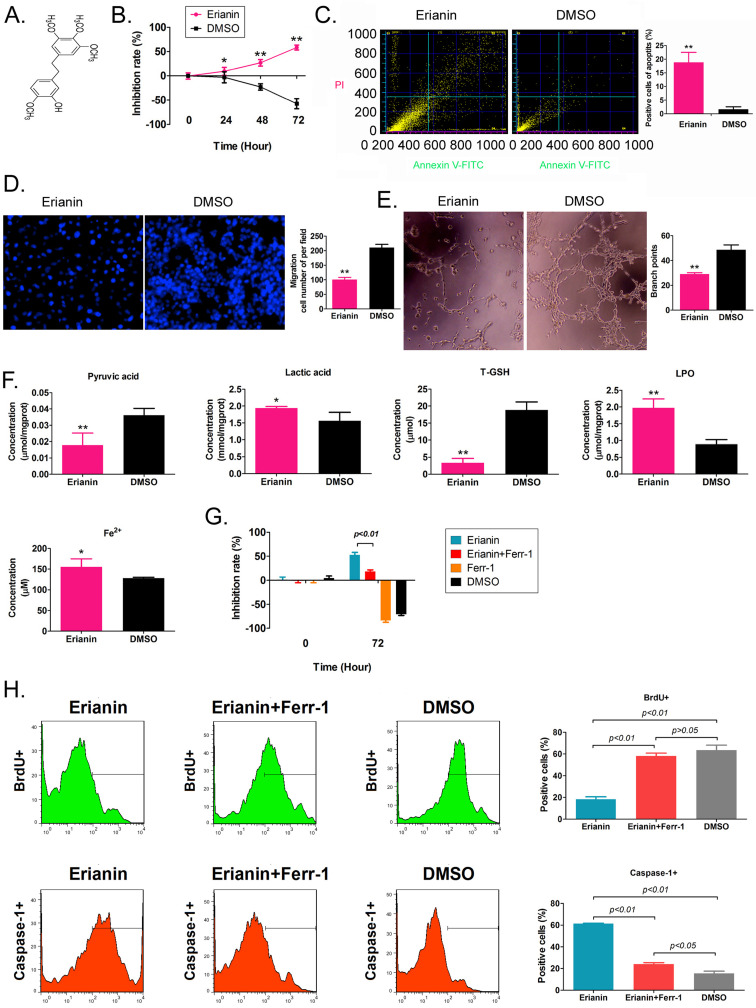
Figure 1.
Erianin significantly decreased the activity of HuRCSCs in vitro. (A) The molecular structure of Erianin. (B) MTT assay results showing that Erianin significantly inhibited the proliferation of HuRCSCs in vitro. **p < 0.01 vs. DMSO; *p < 0.05 vs. DMSO; t test; n = 4. (C) Flow cytometry analysis showing that Erianin induced HuRCSC apoptosis in vitro. **p < 0.01 vs. DMSO; t test; n = 4. (D) Transwell chamber results showing that Erianin significantly inhibited the migration of HuRCSCs in the external matrix. **p < 0.01 vs. DMSO; t test; n = 4. (E) Erianin significantly inhibited the angiogenesis of HUVECs in the external matrix. **p < 0.01 vs. DMSO; t test; n = 4. (F) Biochemical assay showing that Erianin significantly downregulated pyruvate and T-GSH concentrations and upregulated lactic acid, LPO, and Fe2+ concentrations in HuRCSCs. **p < 0.01 vs. DMSO; *p < 0.05 vs. DMSO; t test; n = 4. (G) The MTT results showing that the cell inhibition rate of Erianin + Ferr-1 treatment group was significantly decreased. (H) Flow cytometry analysis results indicated that the precentage of BrdU+ HuRCSCs of Erianin treated group was significantly decreased. (I) Flow cytometry analysis results indicated that the precentage of BrdU+ HuRCSCs of Erianin treated group was significantly elevated.

