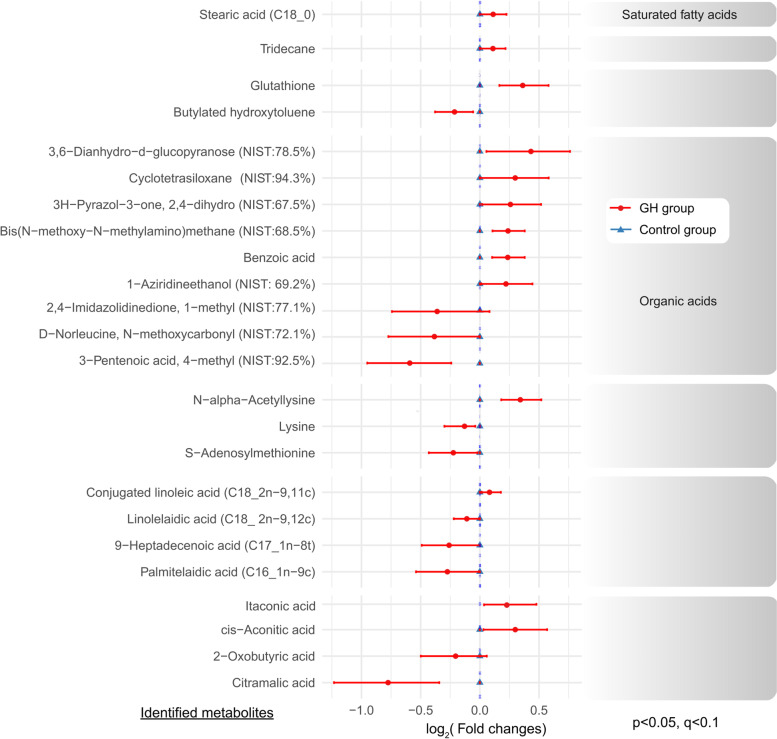
Fig. 3.
The differences in the FF metabolome between the GH and control groups. The relative concentrations of FF metabolites are illustrated via a log2 scale. Positive values represent higher metabolite levels in the dividend group (GH group) than the divisor group (control group), whereas negative values represent lower metabolite levels in the dividend group than the divisor group. Only the metabolites with a p-value less than 0.05 (Student t-test) and a q-value less than 0.01 (false discovery rate) are displayed. FF follicular fluid, GH growth hormone, TCA tricarboxylic acid

