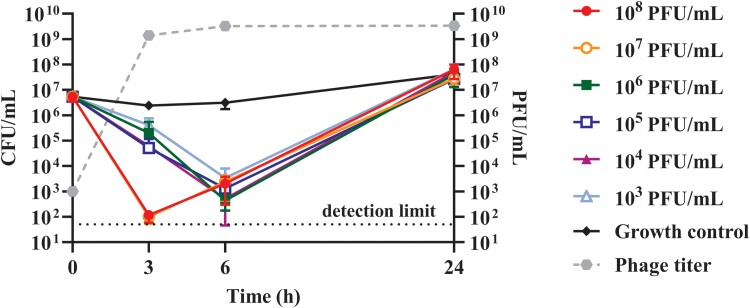
Figure 3.
Lytic activity at 3, 6, and 24 hours of Pa53 versus Pa_RA1 biofilm. Phage application conditions are shown as follow: filled circle (108 plaque-forming units [PFU]/mL), empty circle (107 PFU/mL), filled square (106 PFU/mL), empty square (105 PFU/mL), filled triangle (104 PFU/mL), empty triangle (103 PFU/mL) and diamond (no phage, Growth control). Dashed line represents the phage titer over the time. The 2 higher phage titers showed the greater biofilm reduction after 3 hours, whereas from 106 to 103 PFU/mL the peak of reduction occurred at 6 hours, then, both trends increased like the untreated control at 24 hours. Each point of the graph represents the mean ± standard deviations (error bars) of 3 independent replicates (N = 3). Detection limit (y = 50) for the colony-forming units (CFU)/mL count corresponds to the dotted line.

