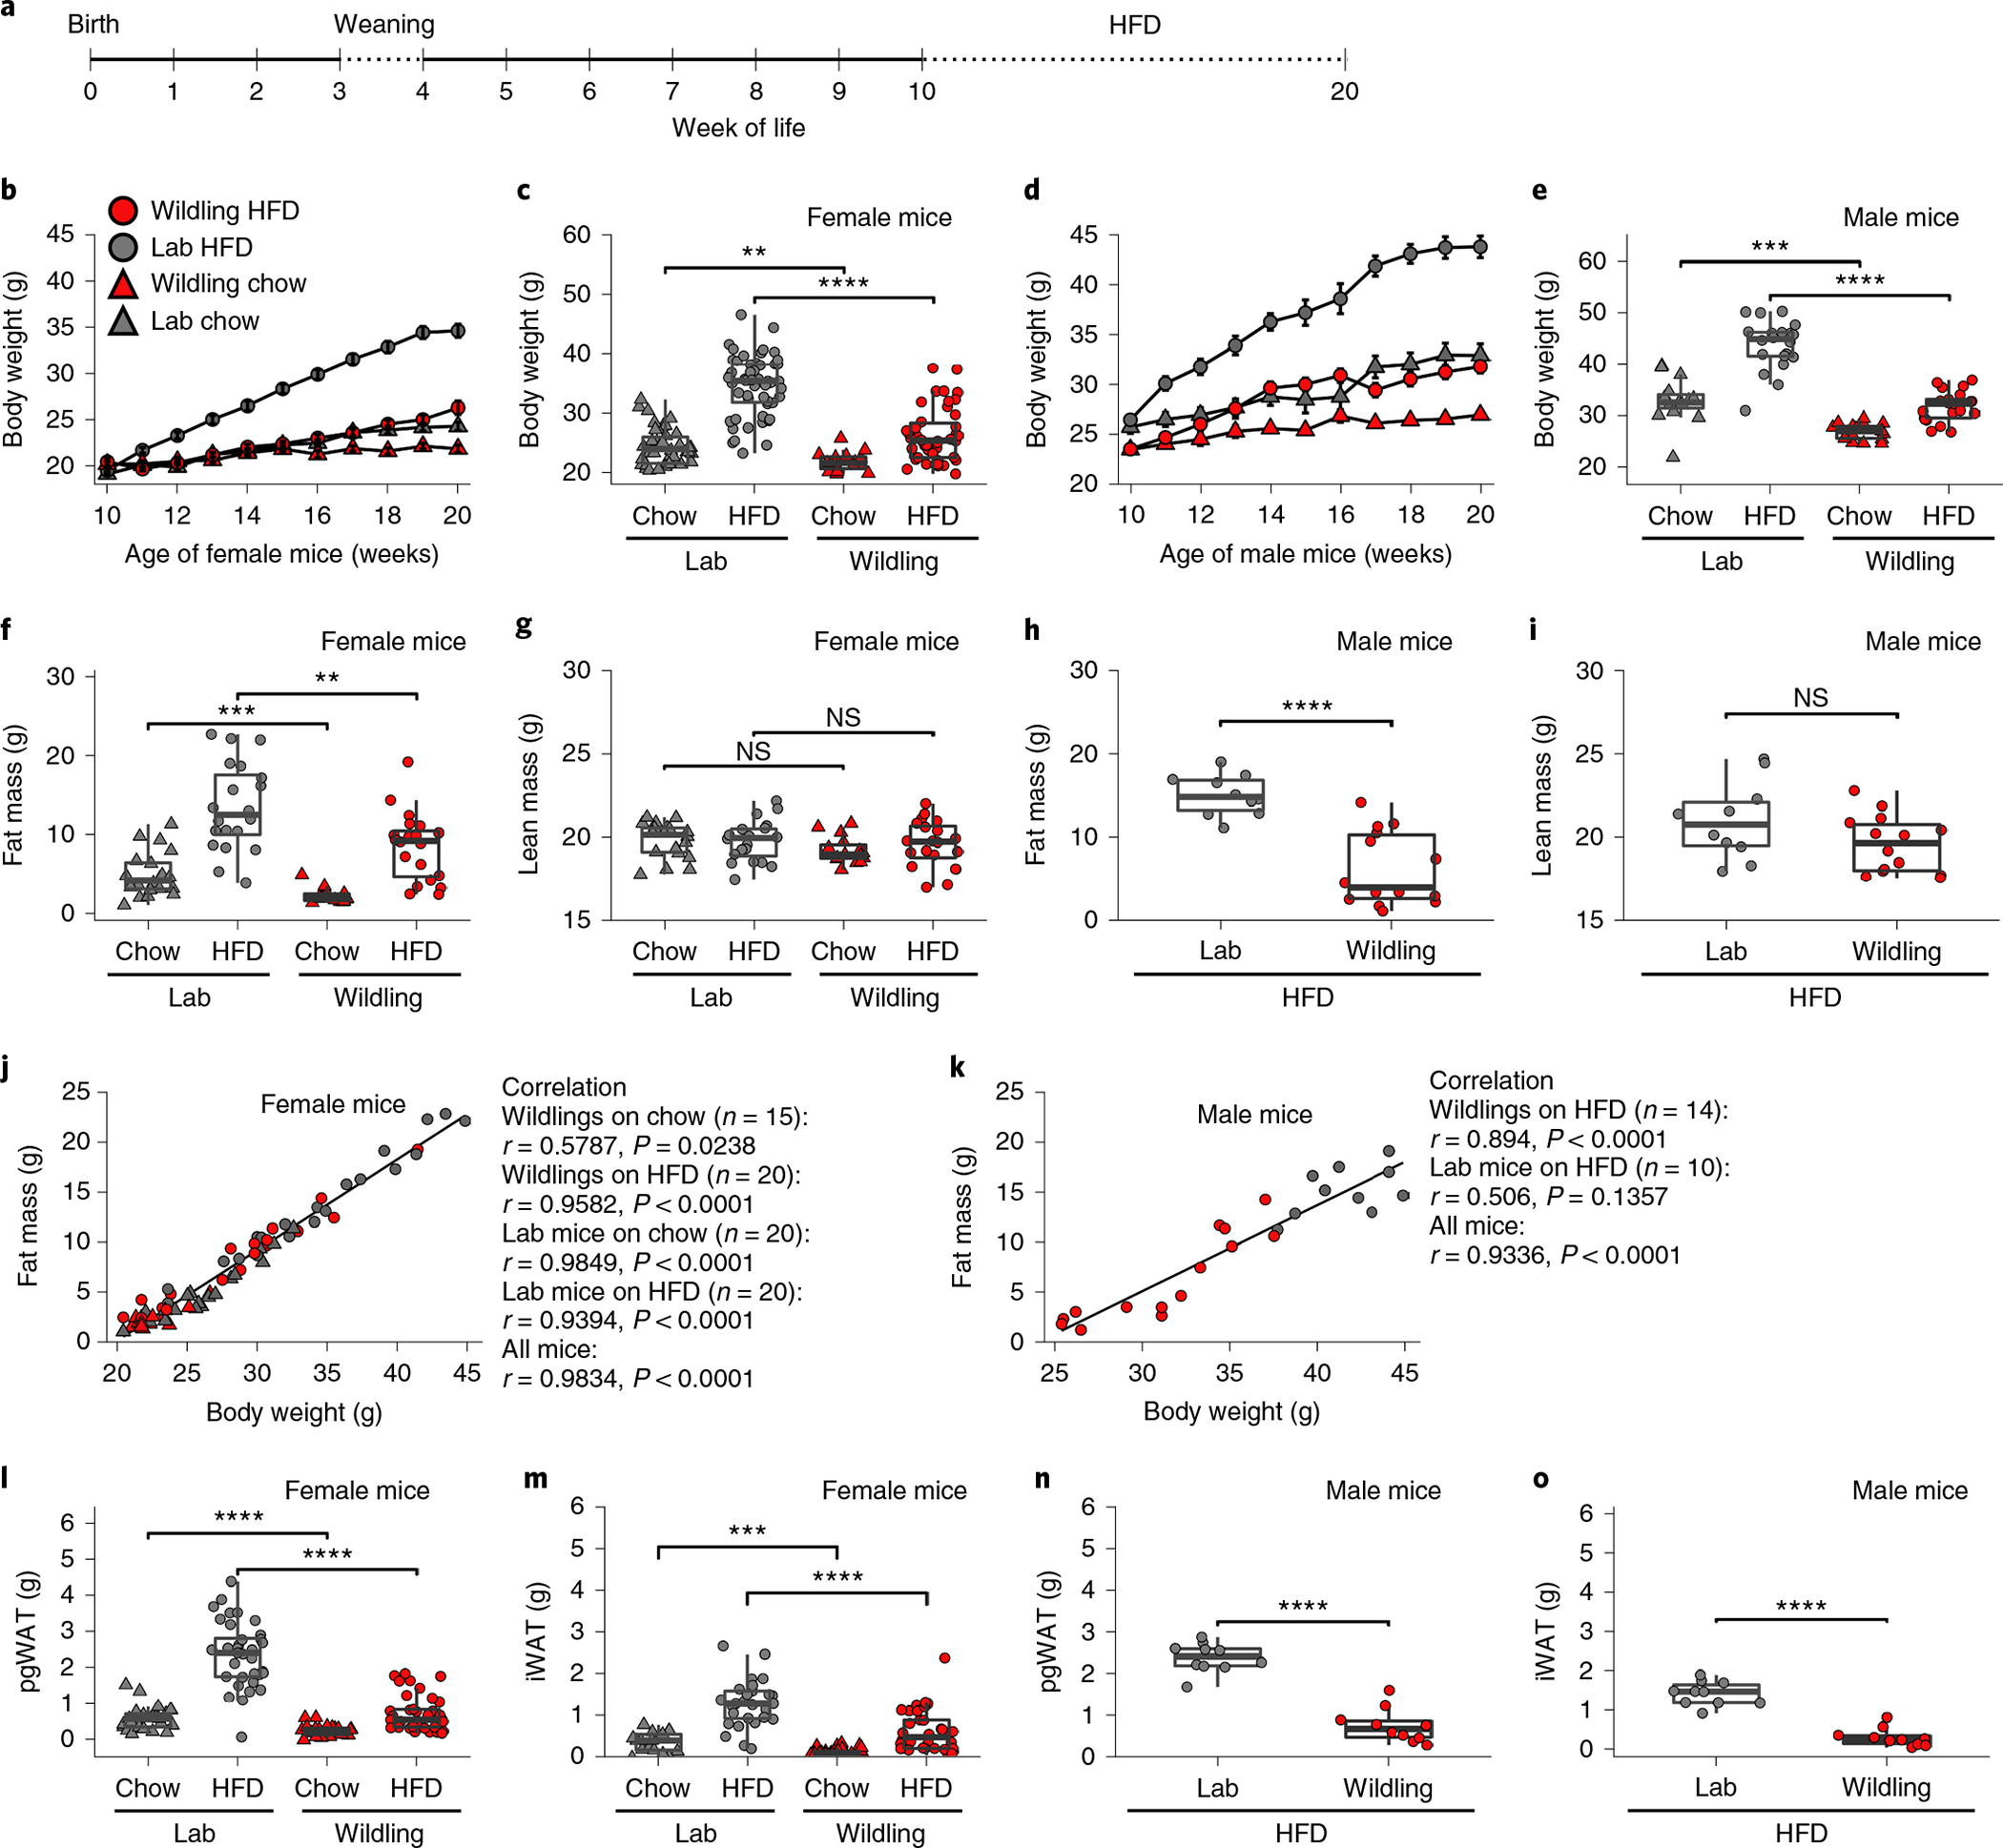
Fig. 1 |. Wildlings are protected from excessive weight gain on HFD.

a, Experimental design. C57BL/6NTac with wild mouse microbiome (wildlings) and C57BL/6NTac with SPF lab mouse microbiome (lab) received a 10-week course of either regular chow or HFD. b,c, Weight of female lab or wildling mice during (b) and after 10 weeks of chow or HFD (c). n = 42 lab mice on chow, n = 55 lab mice on HFD; n = 30 wildlings on chow, n = 60 wildlings on HFD examined over 3 independent experiments. d,e Weight of male lab or wildling mice during (d) and after 10 weeks of chow or HFD (e). n = 15 lab mice on chow, n = 20 lab mice on HFD; n = 17 wildlings on chow, n = 23 wildlings on HFD examined over two independent experiments. f,g, Fat (f) and lean (g) body mass of female mice on chow (n = 20 lab mice, n = 15 wildlings) or HFD (n = 20 lab mice, n = 20 wildlings). h,i, Fat (h) and lean (i) body mass of male mice on HFD (n = 10 lab mice, n = 14 wildlings). j,k, Pearson correlation of body weight and fat mass of female (j) and male (k) lab and wildling mice after 10 weeks of chow or HFD; two independent experiments each, symbols as in b. l,m, Weight of pgWAT (l) and iWAT (m) of female mice after 10 weeks of chow (n = 50 lab mice, n = 78 wildlings) or HFD (n = 57 lab mice, n = 70 wildlings), examined over five independent experiments. n,o, Weight of pgWAT (n) and iWAT (o) of male mice after 10 weeks of HFD (n = 10 lab mice, n = 10 wildlings), examined over two independent experiments. Mean ± s.e.m. are shown (b,d). Box plots show median (centre line), 75th (upper limit of box) and 25th percentiles (lower limit of box) and outliers (whiskers) if values do not exceed 1.5 × interquartile range (c,e–i,l–o). Two-sided Student’s t-test (Gaussian model) (e,g,h,i,n,o); two-sided Wilcoxon rank sum test (c,f,l,m). NS, not significant; **P < 0.01, ***P < 0.001, ****P < 0.0001; exact P values are provided in the Source Data.
