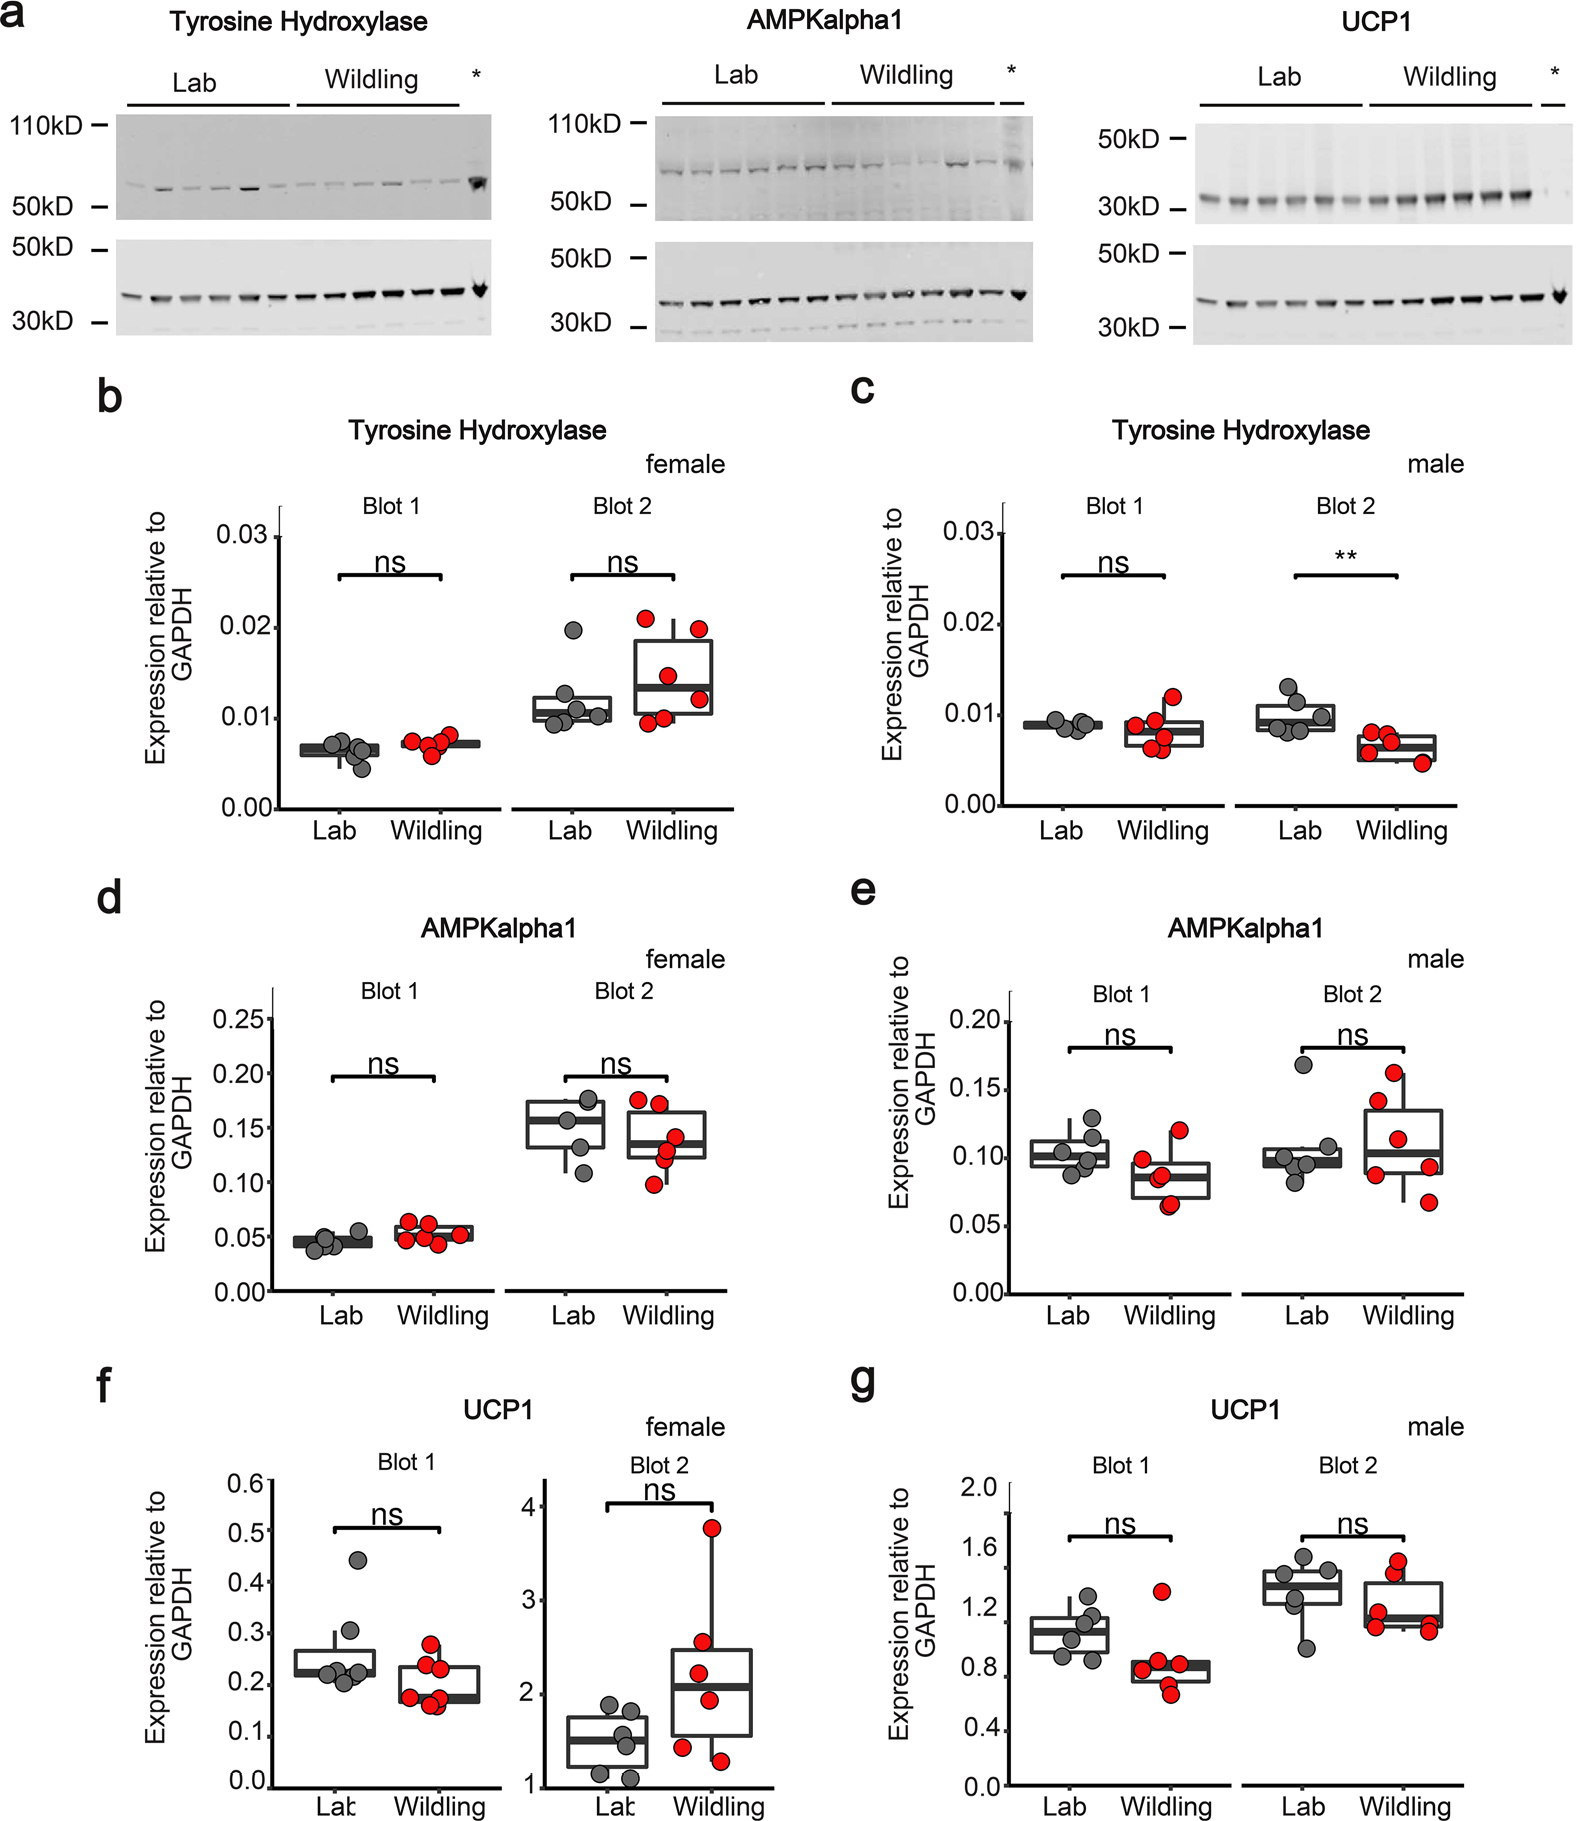
Extended Data Fig. 6 |. Western Blot analysis of AMPKalpha1, tyrosine hydroxylase and UCP1 in iBAT.

a, iBAT from lab and wildling mice at week 10 of HFD was analyzed by Western blot to quantitate the expression of tyrosine hydroxylase, AMPKalpha1 and UCP1 (upper bands) relative to GAPDH (lower bands). Brain lysate was used in the right lane (marked by asterisk). Representative Western Blot images for male mice (n = 6 mice per group). Unprocessed Western Blots are shown in Source Data. The experiment was independently repeated once for males and twice for females with similar results. b-g, The density of Western blot bands was quantified and normalized to each sample’s respective GAPDH band. Normalized expression levels are shown for tyrosine hydroxylase (b, c), AMPKalpha1 (d, e) and UCP1 (f, g) for female (b, d, f) and male (c, e, g) mice. N = 12 mice per group (b, c, e, g); n = 6 mice per group except n = 5 for the lab mouse group in blot 2 (d), n = 7 mice per group in blot 1, n = 6 mice per group in blot 2 (f). Box plots show median (center line), 75th (upper limit of box) and 25th percentile (lower limit of box) and outliers (whiskers) if values do not exceed 1.5-times interquartile range. Two-sided Wilcoxon signed rank test (NS, not significant; ** p = 0.007538).
