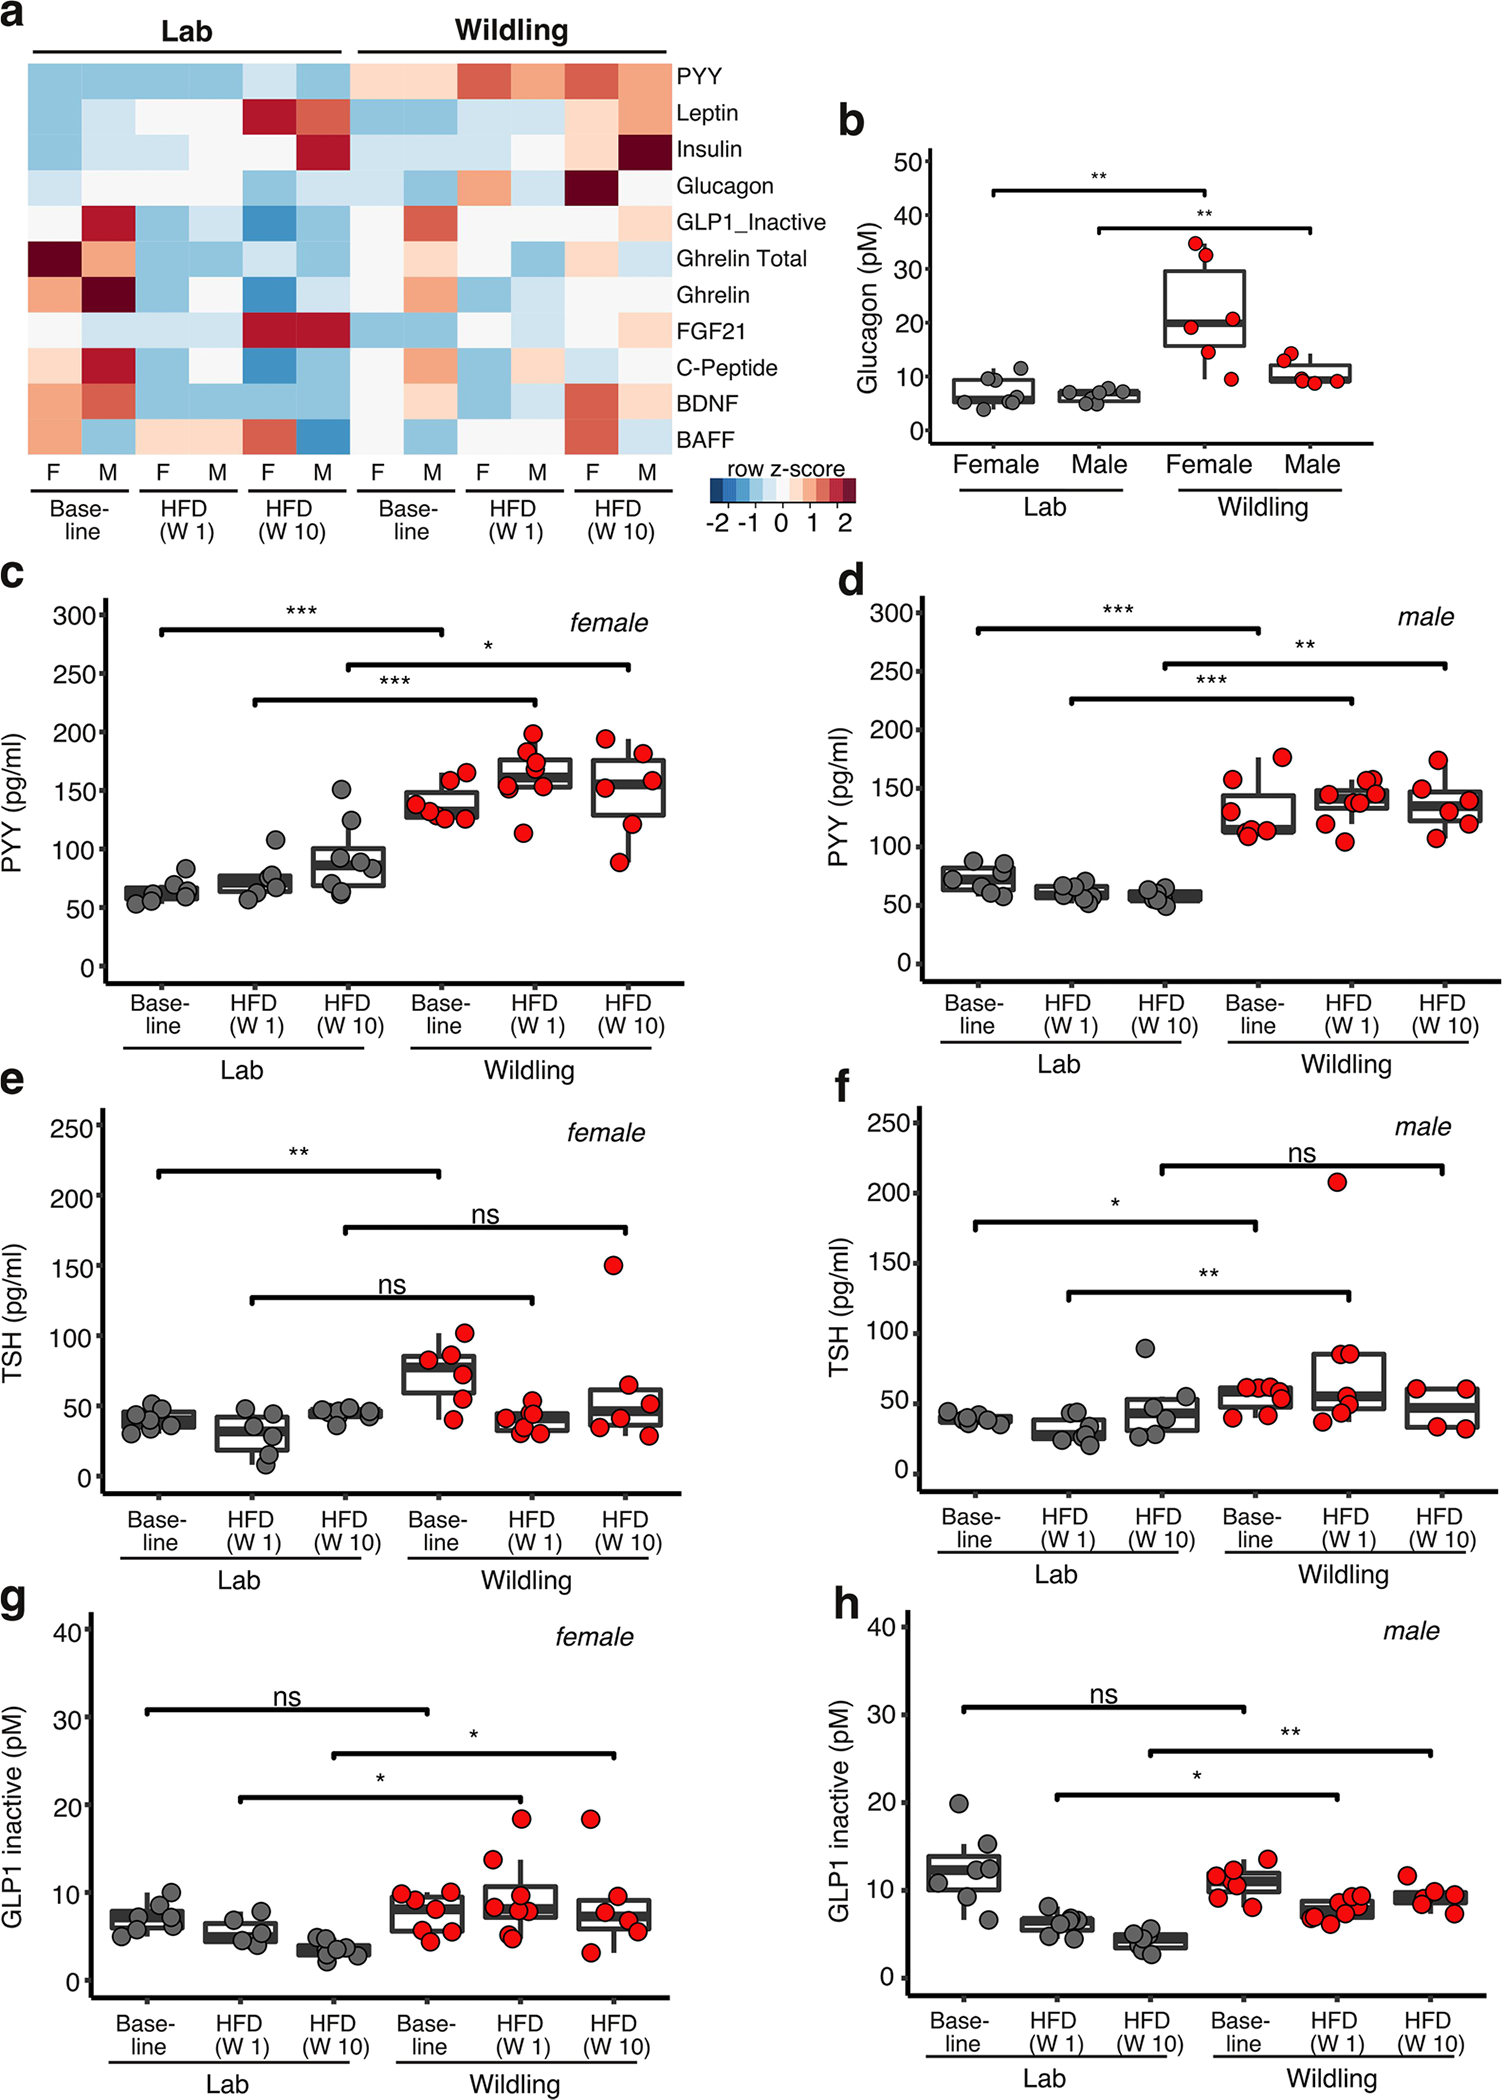
Extended Data Fig. 7 |. Metabolic hormones of lab and wildling mice on chow and HFD.

Serum concentration of metabolic hormones of lab mice and wildlings at baseline (week 10 of age on chow diet) and after 1 week and 10 weeks of HFD (weeks 11 and 20 of age, respectively). Each sample was pooled from two mice. Female lab mice at baseline, n = 14; at week 1 of HFD, n = 12; at week 10 of HFD, n = 16; male lab mice at baseline, n = 14; at week 1 of HFD, n = 14; at week 10 of HFD, n = 14; female wildlings at baseline, n = 14; at week 1 on HFD, n = 16; at week 10 of HFD, n = 12; male wildlings at baseline, n = 14; at week 1 of HFD, n = 16; at week 10 of HFD, n = 12. a Heatmap displaying median value of each group presented as z-score. BDNF, brain derived neurotropic factor; BAFF, B-cell activating factor. The Mesoscale Mouse Metabolic Combo 1 multiplex assay was used. b-h Serum concentration of glucagon (b), peptide YY (PYY) (c, d), thyroid stimulating hormone (TSH) (e, f), and the inactive form of glucagon like peptide 1 (GLP1) (g, h) at the indicated time points on chow or HFD as determined by multiplex Mesoscale Mouse Metabolic Combo 1 multiplex assay (b, c, d, g, h) or ELISA (e, f). Box plots show median (center line), 75th (upper limit of box) and 25th percentile (lower limit of box) and outliers (whiskers) if values do not exceed 1.5-times interquartile range. Two-sided Wilcoxon signed rank test (NS, not significant; * p < 0.05, ** p < 0.01, *** p < 0.001, **** p < 0.0001, exact p-values are shown in the Source Data).
