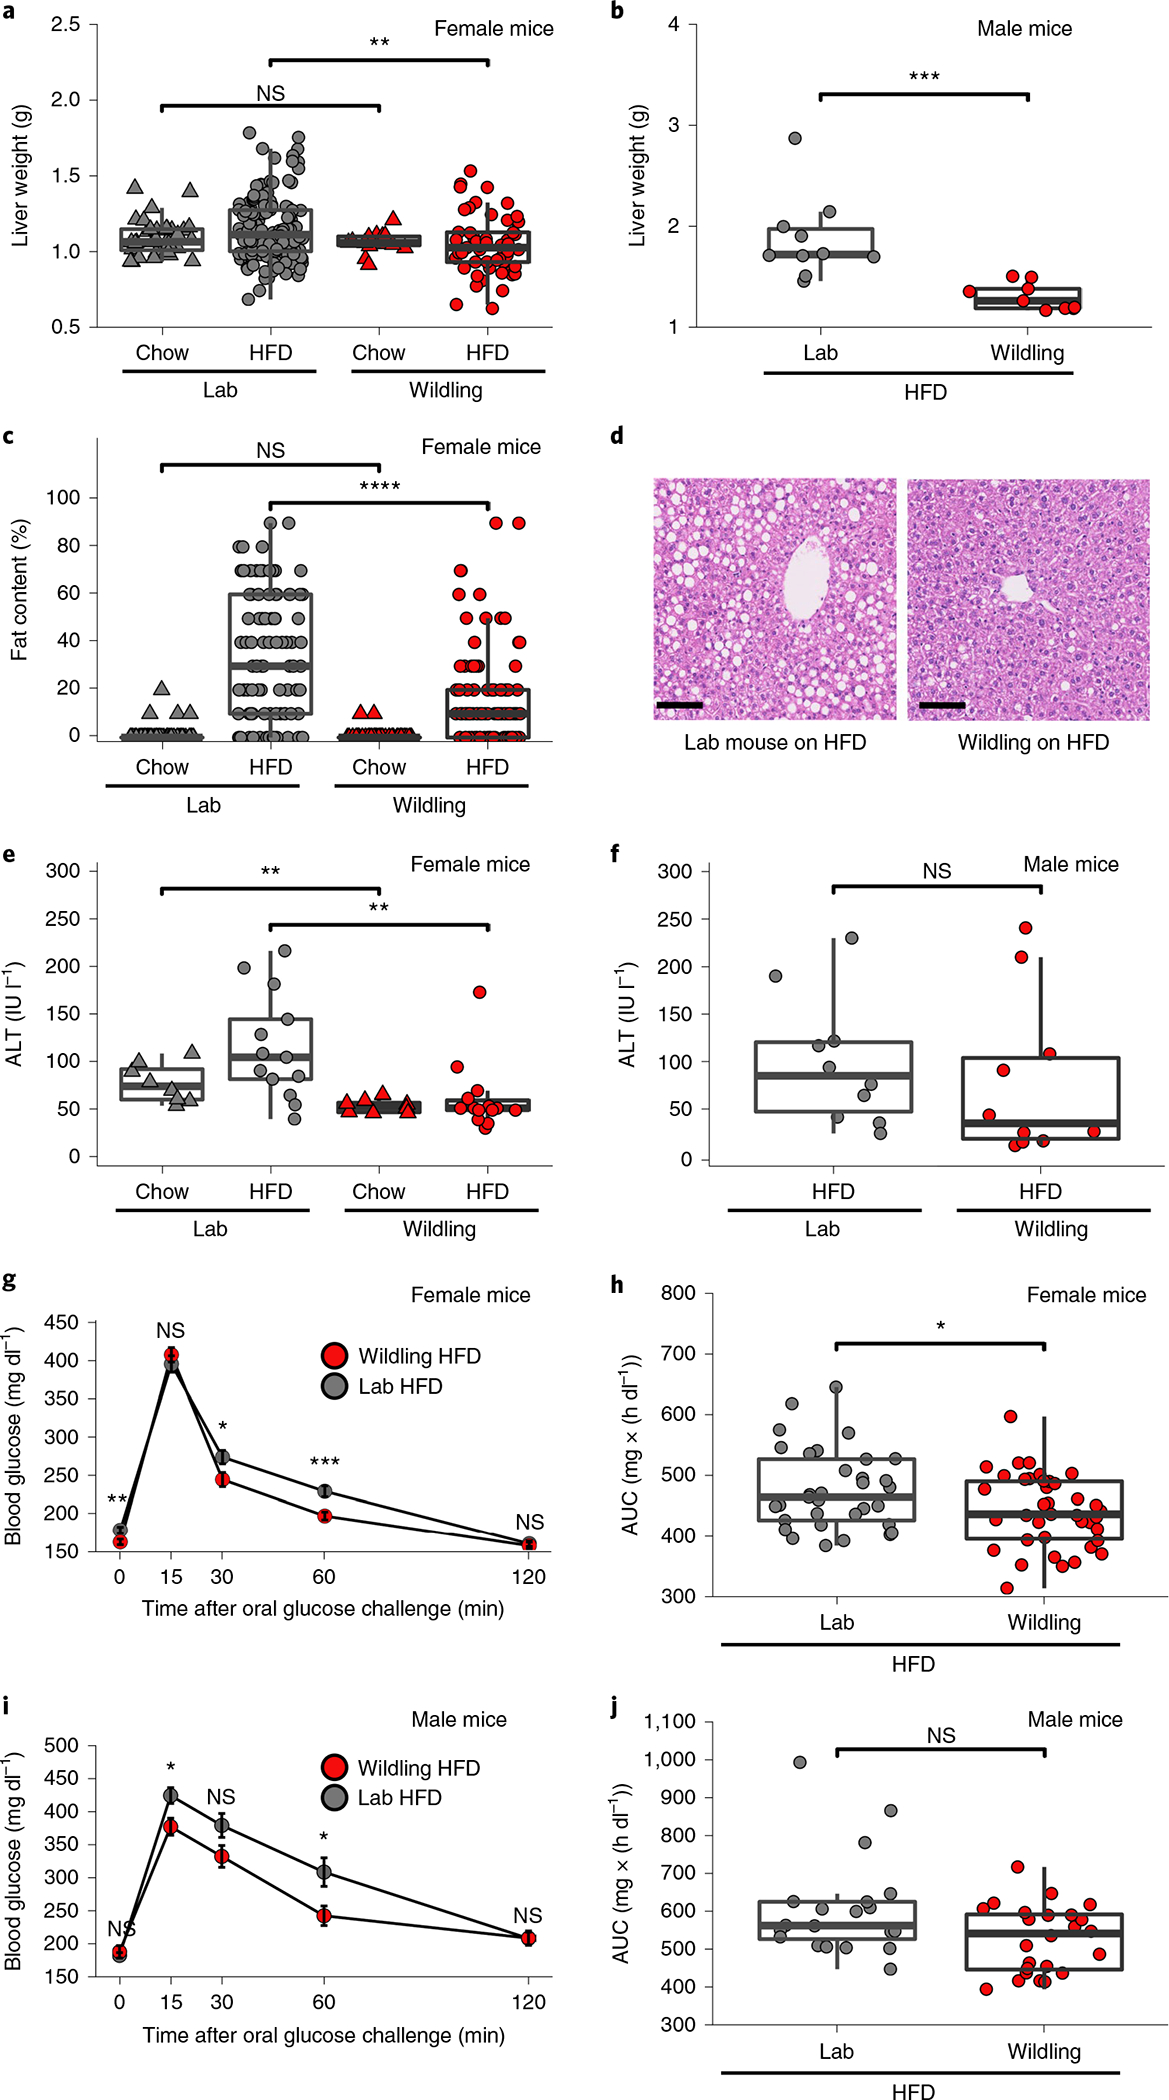
Fig. 2 |. Wildlings are protected from adverse metabolic effects of HFD.

a,b, Liver weight of female (a) or male (b) lab or wildling mice at week 10 of chow or HFD; n = 159 lab mice on HFD, n = 55 lab mice on chow; n = 95 wildlings on HFD, n = 78 wildlings on chow examined over three independent experiments (a); n = 10 lab mice, n = 10 wildlings examined over two independent experiments (b). c, Liver fat content of female lab and wildling mice at 10, 20 or 30 weeks of age on chow and at 20 or 30 weeks of age on HFD as assessed by scoring of liver histology by two independent assessors. n = 47 lab mice on chow, n = 50 lab mice on HFD; n = 38 wildlings on chow, n = 52 wildlings on HFD examined over three independent experiments. d, Hematoxylin and eosin (H&E)-stained liver histology from female lab and wildling mice after 10 weeks of HFD, representative for data in c obtained over three independent experiments. Scale bars, 100 μm. e,f, Serum alanine aminotransferase (ALT) activity of female (e) and male (f) lab or wildling mice after 10 weeks of chow or HFD. n = 8 lab mice on chow, n = 14 lab mice on HFD; n = 8 wildlings on chow, n = 14 wildlings on HFD (e); n = 10 lab mice, n = 10 wildlings (f). g,h, Oral glucose tolerance test of female mice (n = 33 lab mice, n = 39 wildlings) on HFD showing blood glucose levels at different times of the test (g) and glucose area under the curve (AUC) for the entire assay (h). Data are from three independent experiments. i,j, Oral glucose tolerance test of male mice (n = 20 lab mice, n = 24 wildlings) on HFD showing blood glucose levels at different times of the test (i) and glucose area under the curve (AUC) for the entire assay (j). Data are from three independent experiments. Data are presented as mean values ± s.e.m. (g,i). Box plots show median (centre line), 75th (upper limit of box) and 25th percentiles (lower limit of box) and outliers (whiskers) if values do not exceed 1.5 × interquartile range (a–c,e,f,h,j); *P < 0.05, **P < 0.01, ***P < 0.001. Unpaired two-sided Student’s t-test (Gaussian model) (b); two-sided Wilcoxon rank sum test (a,c,e,f–j). *P < 0.05, **P < 0.01, ***P < 0.001, ****P < 0.0001; exact P values are provided in the Source Data. IU, international units.
