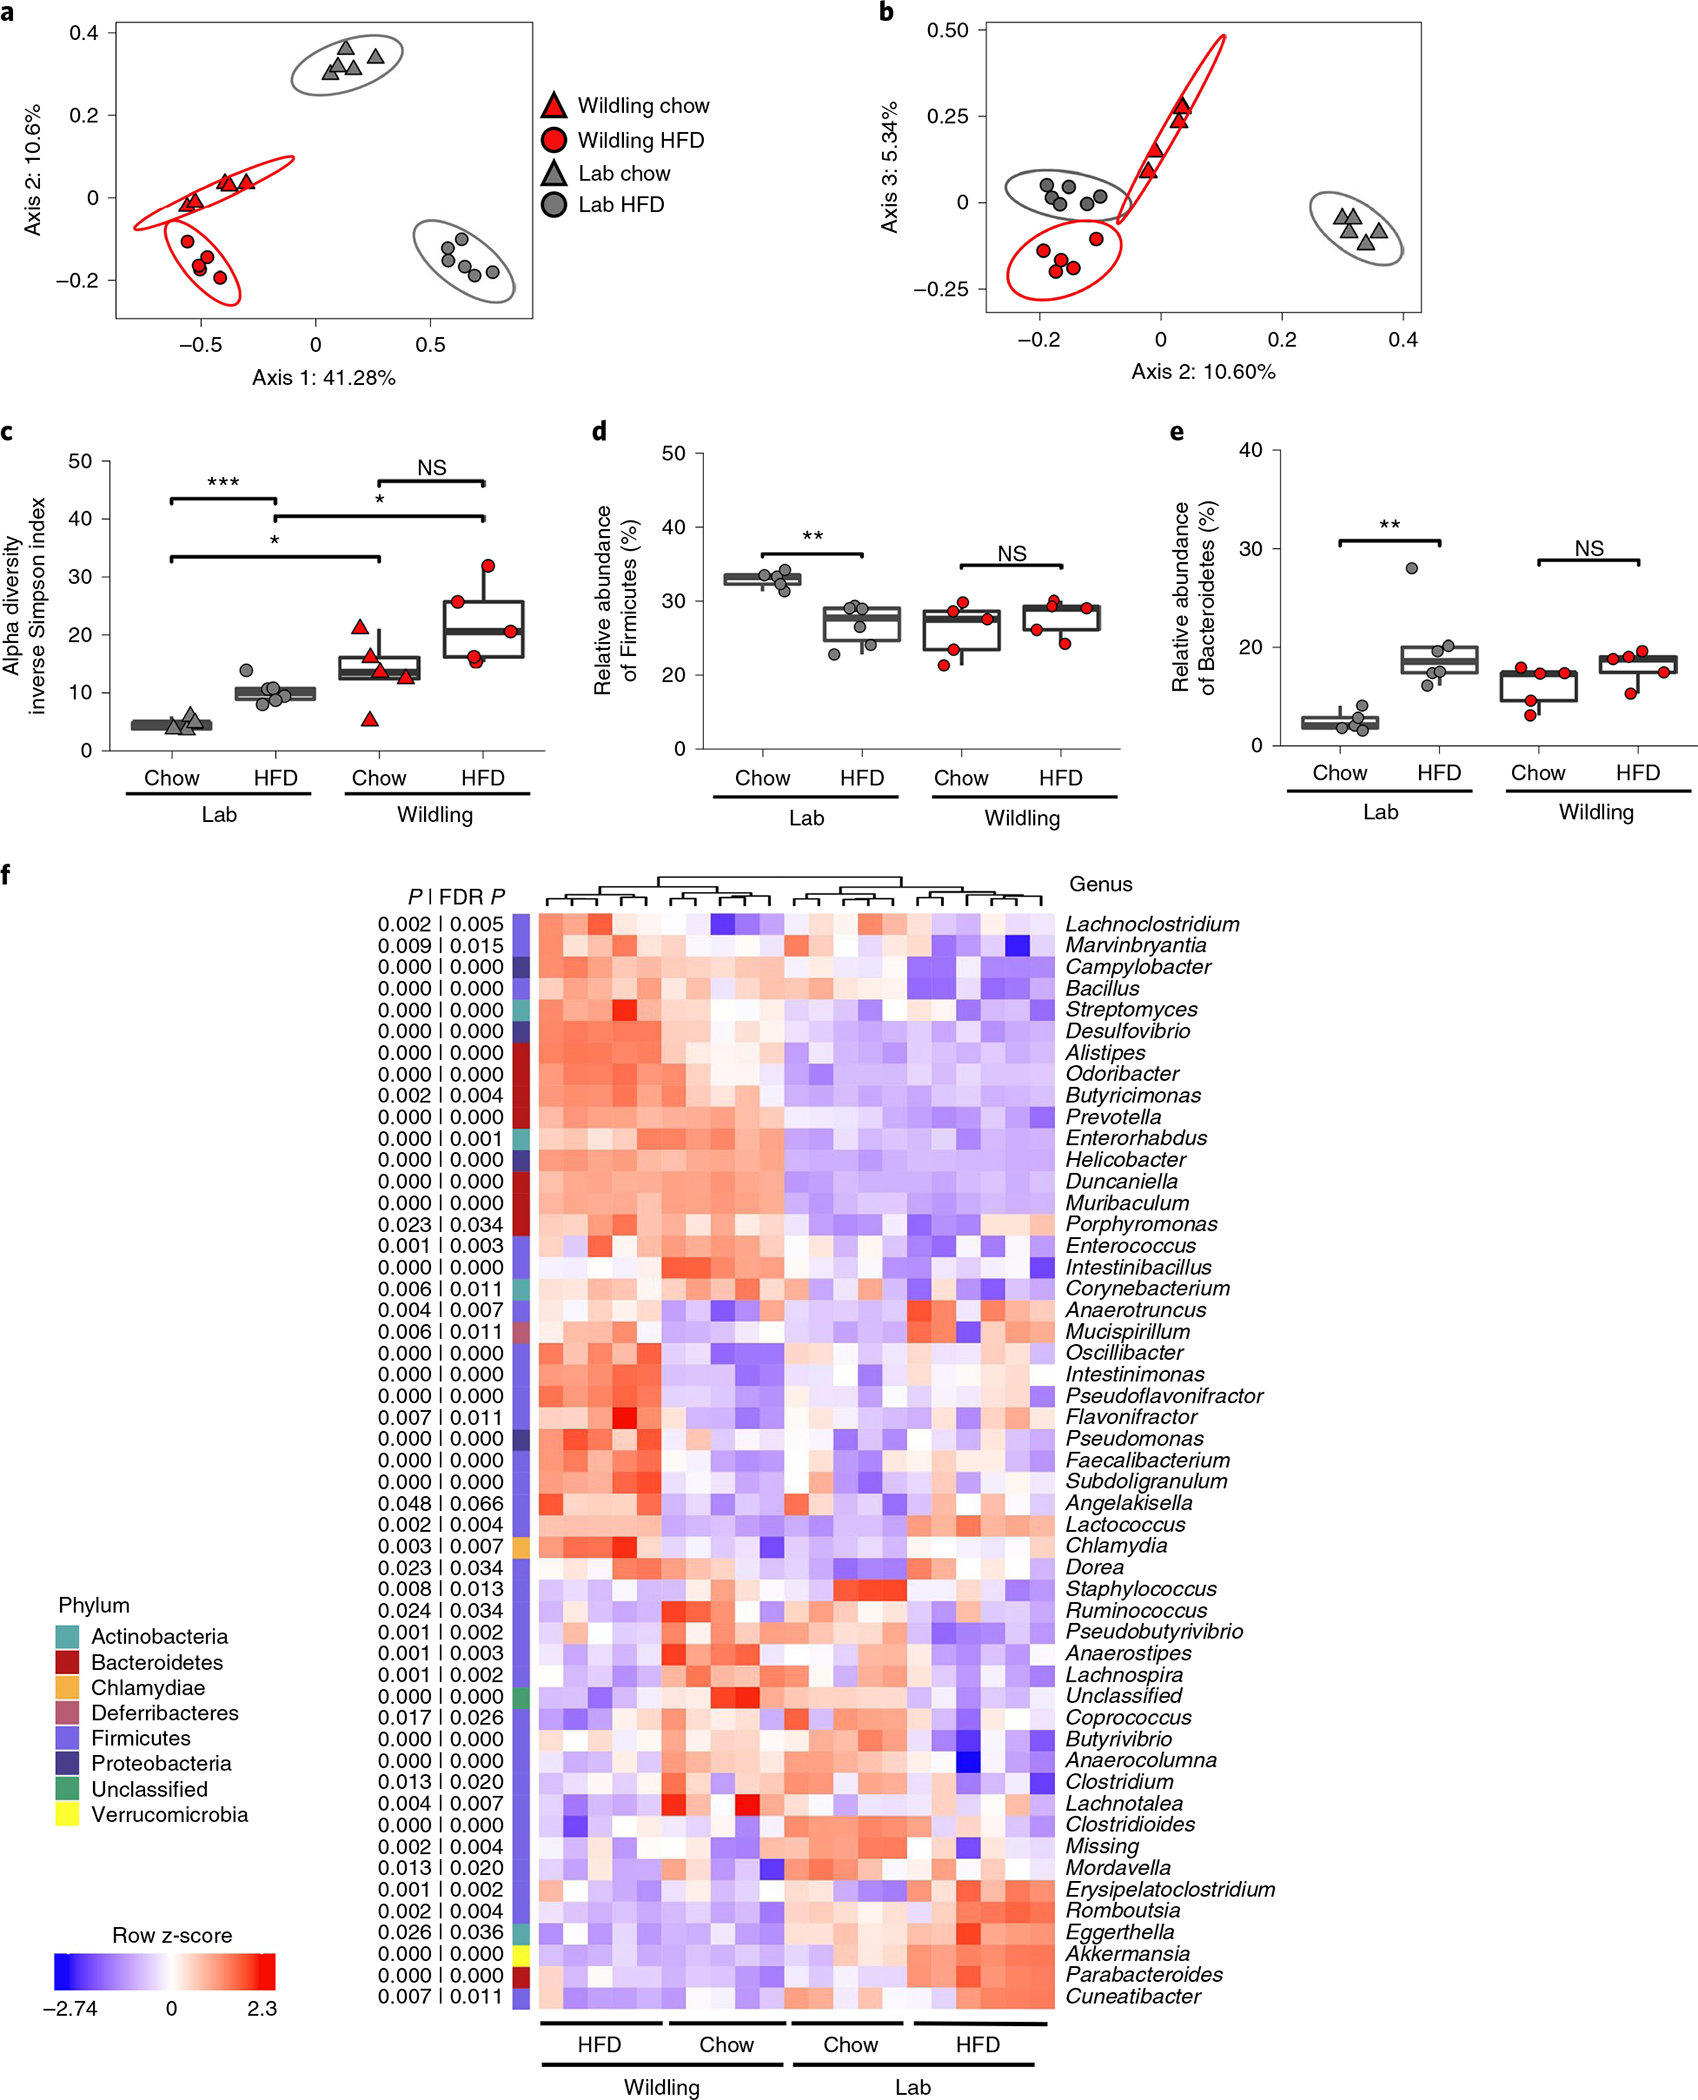
Fig. 3 |. HFD-induced changes in the wildling and lab mouse microbiome.

Shotgun metagenomics data comparing the caecal microbiome of female wildling and lab mice at week 10 of chow or HFD. a,b, PCoA (Jaccard distance) of first and second (a) and the second and third (b) most variant axes. c, Alpha diversity expressed as inverse Simpson index. d,e, Relative abundance of the phyla Firmicutes (d) and Bacteroidetes (e). f, Heat map generated by unsupervised clustering, showing the top 50 most variant genera (false discovery rate (FDR)-adjusted P < 0.05 across groups by analysis of variance test) after filtering based on taxon genome completeness of >10% in at least 5% of samples and abundance of >250 parts per million in at least 15% of samples. Relative abundances are shown as z-score. n = 6 lab mice on HFD, n = 6 lab mice on chow; n = 5 wildlings on HFD, n = 5 wildlings on chow (c–e). Box plots show median (centre line), 75th (upper limit of box) and 25th percentiles (lower limit of box) and outliers (whiskers) if values do not exceed 1.5 × interquartile range (c–e). Unpaired two-sided Student’s t-test (Gaussian mode) (b); two-sided Wilcoxon rank sum test (c–f). *P < 0.05, **P < 0.01, ***P < 0.001; exact P values are provided in the Source Data.
