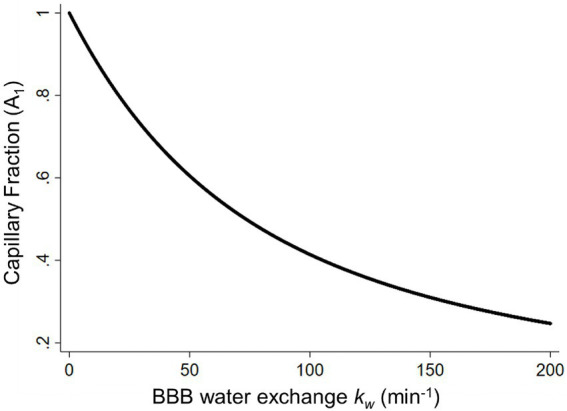
Figure 4.

The capillary fraction of labeled water (A1) plotted as a function of the BBB water-exchange rate kw (min−1). Simulated data was generated using the arterial transit time, the T1 of arterial blood (1.66 s) and gray matter (1.82 s), the labeling efficiency (85%), the brain–blood partition coefficient (0.9 ml/g), and the b values (0 and 50 s/mm2) at a long post labeling delay (1.80 s) as inputs for the look-up table algorithm. BBB, blood–brain barrier [adapted with permission from Uchida et al. (2022a)].
